


常见的消息订阅模式有两种情形,一种是推,即产生一条消息时,即刻推送给所有客户端(或者对应的DB存储下来);另外一种是拉,即产生一条消息 时,并不做任何动作,而是当真正需要数据时,再去生成。对应到实际编程中,也有类似的概念,例如,实时计算vs延迟计算(lazy evaluation)。
下面是Prometheus的架构图:
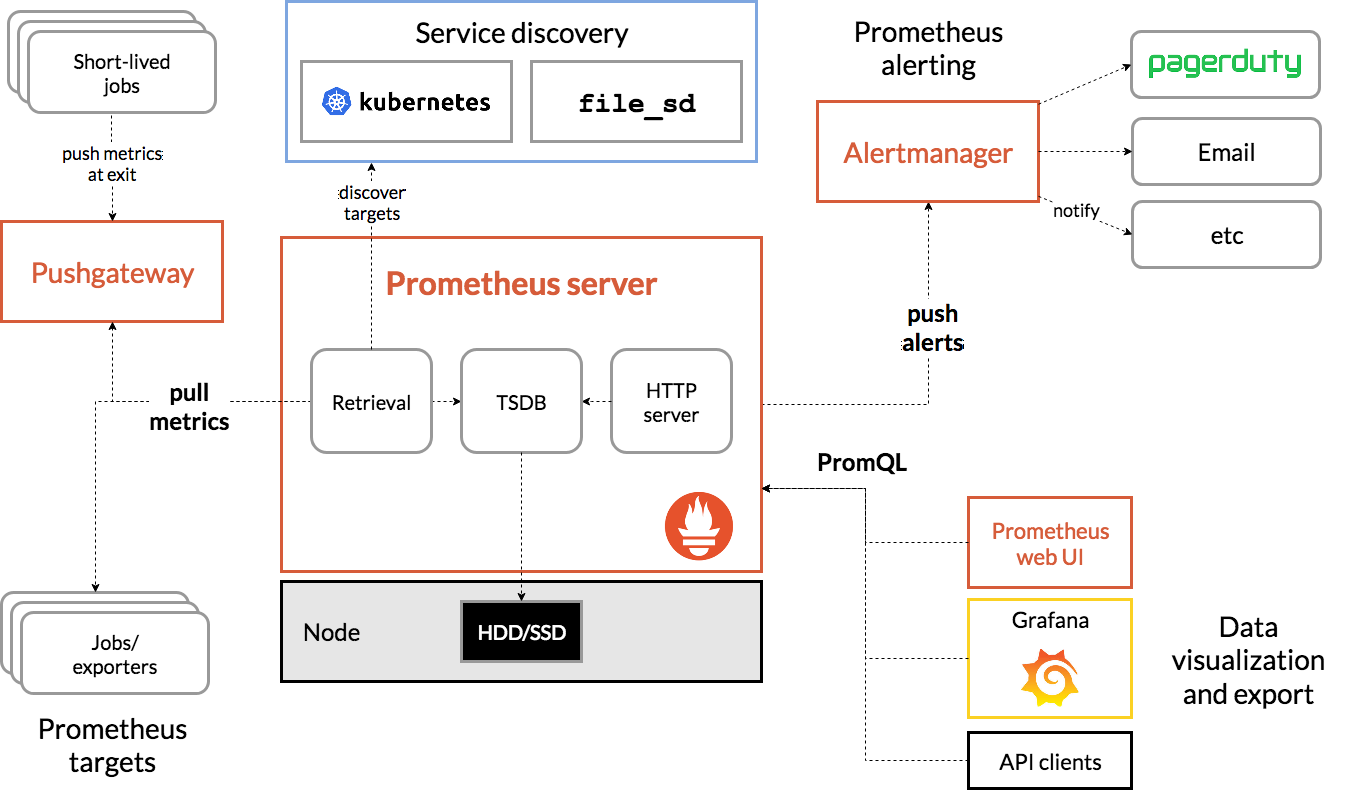
可以看到,Prometheus使用拉取的模式(虽然配备了一个Pushgateway用于实现推的模式)。也就是说,Prometheus是客户端准备好数据并且存起来, Prometheus定期去拉取数据,这样做有一个好处,就是当服务器负载非常高时,Prometheus可以延迟拉取,等到负载降低之后再拉取数据,因而不会 出现被压垮的情况(如果服务端已经负载极高,而客户端再次多次重试就会出现这种情况)。
接下来我们进入正题,看看MySQL Exporter的实现。如我在 如何阅读源代码 一文中所写,从main函数进入往往是个不错的方案:
func main() {
	// Generate ON/OFF flags for all scrapers.
	scraperFlags := map[collector.Scraper]*bool{}
	for scraper, enabledByDefault := range scrapers {
		defaultOn := "false"
		if enabledByDefault {
			defaultOn = "true"
		}

		f := kingpin.Flag(
			"collect."+scraper.Name(),
			scraper.Help(),
		).Default(defaultOn).Bool()

		scraperFlags[scraper] = f
	}

	// Parse flags.
	log.AddFlags(kingpin.CommandLine)
	kingpin.Version(version.Print("mysqld_exporter"))
	kingpin.HelpFlag.Short('h')
	kingpin.Parse()

	// landingPage contains the HTML served at '/'.
	// TODO: Make this nicer and more informative.
	var landingPage = []byte(`<html>
<head><title>MySQLd exporter</title></head>
<body>
<h1>MySQLd exporter</h1>
<p><a href='` + *metricPath + `'>Metrics</a></p>
</body>
</html>
`)

	log.Infoln("Starting mysqld_exporter", version.Info())
	log.Infoln("Build context", version.BuildContext())

	dsn = os.Getenv("DATA_SOURCE_NAME")
	if len(dsn) == 0 {
		var err error
		if dsn, err = parseMycnf(*configMycnf); err != nil {
			log.Fatal(err)
		}
	}

	// Register only scrapers enabled by flag.
	log.Infof("Enabled scrapers:")
	enabledScrapers := []collector.Scraper{}
	for scraper, enabled := range scraperFlags {
		if *enabled {
			log.Infof(" --collect.%s", scraper.Name())
			enabledScrapers = append(enabledScrapers, scraper)
		}
	}
	handlerFunc := newHandler(collector.NewMetrics(), enabledScrapers)
	http.HandleFunc(*metricPath, prometheus.InstrumentHandlerFunc("metrics", handlerFunc))
	http.HandleFunc("/", func(w http.ResponseWriter, r *http.Request) {
		w.Write(landingPage)
	})

	log.Infoln("Listening on", *listenAddress)
	log.Fatal(http.ListenAndServe(*listenAddress, nil))
}
可以看到,MySQL Exporter提供了两个URL供访问,一个是 /,用于打印一些基本的信息,另一个就是用于收集metrics的 /metrics 链接。
我们进去看看 /metrics 对应的handler,它是由 newHandler 生成的:
func newHandler(metrics collector.Metrics, scrapers []collector.Scraper) http.HandlerFunc {
	return func(w http.ResponseWriter, r *http.Request) {
		filteredScrapers := scrapers
		params := r.URL.Query()["collect[]"]
		// Use request context for cancellation when connection gets closed.
		ctx := r.Context()
		// If a timeout is configured via the Prometheus header, add it to the context.
		if v := r.Header.Get("X-Prometheus-Scrape-Timeout-Seconds"); v != "" {
			timeoutSeconds, err := strconv.ParseFloat(v, 64)
			if err != nil {
				log.Errorf("Failed to parse timeout from Prometheus header: %s", err)
			} else {
				if *timeoutOffset >= timeoutSeconds {
					// Ignore timeout offset if it doesn't leave time to scrape.
					log.Errorf(
						"Timeout offset (--timeout-offset=%.2f) should be lower than prometheus scrape time (X-Prometheus-Scrape-Timeout-Seconds=%.2f).",
						*timeoutOffset,
						timeoutSeconds,
					)
				} else {
					// Subtract timeout offset from timeout.
					timeoutSeconds -= *timeoutOffset
				}
				// Create new timeout context with request context as parent.
				var cancel context.CancelFunc
				ctx, cancel = context.WithTimeout(ctx, time.Duration(timeoutSeconds*float64(time.Second)))
				defer cancel()
				// Overwrite request with timeout context.
				r = r.WithContext(ctx)
			}
		}
		log.Debugln("collect query:", params)

		// Check if we have some "collect[]" query parameters.
		if len(params) > 0 {
			filters := make(map[string]bool)
			for _, param := range params {
				filters[param] = true
			}

			filteredScrapers = nil
			for _, scraper := range scrapers {
				if filters[scraper.Name()] {
					filteredScrapers = append(filteredScrapers, scraper)
				}
			}
		}

		registry := prometheus.NewRegistry()
		registry.MustRegister(collector.New(ctx, dsn, metrics, filteredScrapers))

		gatherers := prometheus.Gatherers{
			prometheus.DefaultGatherer,
			registry,
		}
		// Delegate http serving to Prometheus client library, which will call collector.Collect.
		h := promhttp.HandlerFor(gatherers, promhttp.HandlerOpts{})
		h.ServeHTTP(w, r)
	}
}
而关键就在于 registry.MustRegister 要求给的参数是符合 Collector 接口的实现,也就是说,每次需要收集信息的时候,就会调用
Collector 接口的 Collect 方法:
type Collector interface {
	Describe(chan<- *Desc)
	Collect(chan<- Metric)
}
因此,我们看看 collector.New 返回的实现的 Collect 方法:
type Exporter struct {
	ctx      context.Context
	dsn      string
	scrapers []Scraper
	metrics  Metrics
}

func (e *Exporter) Collect(ch chan<- prometheus.Metric) {
	e.scrape(e.ctx, ch)

	ch <- e.metrics.TotalScrapes
	ch <- e.metrics.Error
	e.metrics.ScrapeErrors.Collect(ch)
	ch <- e.metrics.MySQLUp
}

func (e *Exporter) scrape(ctx context.Context, ch chan<- prometheus.Metric) {
	e.metrics.TotalScrapes.Inc()
	var err error

	scrapeTime := time.Now()
	db, err := sql.Open("mysql", e.dsn)
	if err != nil {
		log.Errorln("Error opening connection to database:", err)
		e.metrics.Error.Set(1)
		return
	}
	defer db.Close()

	// By design exporter should use maximum one connection per request.
	db.SetMaxOpenConns(1)
	db.SetMaxIdleConns(1)
	// Set max lifetime for a connection.
	db.SetConnMaxLifetime(1 * time.Minute)

	if err := db.PingContext(ctx); err != nil {
		log.Errorln("Error pinging mysqld:", err)
		e.metrics.MySQLUp.Set(0)
		e.metrics.Error.Set(1)
		return
	}

	e.metrics.MySQLUp.Set(1)

	ch <- prometheus.MustNewConstMetric(scrapeDurationDesc, prometheus.GaugeValue, time.Since(scrapeTime).Seconds(), "connection")

	version := getMySQLVersion(db)
	var wg sync.WaitGroup
	defer wg.Wait()
	for _, scraper := range e.scrapers {
		if version < scraper.Version() {
			continue
		}

		wg.Add(1)
		go func(scraper Scraper) {
			defer wg.Done()
			label := "collect." + scraper.Name()
			scrapeTime := time.Now()
			if err := scraper.Scrape(ctx, db, ch); err != nil {
				log.Errorln("Error scraping for "+label+":", err)
				e.metrics.ScrapeErrors.WithLabelValues(label).Inc()
				e.metrics.Error.Set(1)
			}
			ch <- prometheus.MustNewConstMetric(scrapeDurationDesc, prometheus.GaugeValue, time.Since(scrapeTime).Seconds(), label)
		}(scraper)
	}
}
可以看到最后,收集器并发收集所有指标,每个具体指标都会实现 Scraper 这个接口:
// Scraper is minimal interface that let's you add new prometheus metrics to mysqld_exporter.
type Scraper interface {
	// Name of the Scraper. Should be unique.
	Name() string

	// Help describes the role of the Scraper.
	// Example: "Collect from SHOW ENGINE INNODB STATUS"
	Help() string

	// Version of MySQL from which scraper is available.
	Version() float64

	// Scrape collects data from database connection and sends it over channel as prometheus metric.
	Scrape(ctx context.Context, db *sql.DB, ch chan<- prometheus.Metric) error
}
那接下来思路就很清晰了,每个指标都实现这个接口就ok了,而具体的指标,就在 Scrape 这个接口里,从数据库里查出来,并且利用
各种方式把需要的数据提取出来,例如文本解析,正则等等。我们来看一个简单的收集器:
// Scrape collects data from database connection and sends it over channel as prometheus metric.
func (ScrapeEngineInnodbStatus) Scrape(ctx context.Context, db *sql.DB, ch chan<- prometheus.Metric) error {
	rows, err := db.QueryContext(ctx, engineInnodbStatusQuery)
	if err != nil {
		return err
	}
	defer rows.Close()

	var typeCol, nameCol, statusCol string
	// First row should contain the necessary info. If many rows returned then it's unknown case.
	if rows.Next() {
		if err := rows.Scan(&typeCol, &nameCol, &statusCol); err != nil {
			return err
		}
	}

	// 0 queries inside InnoDB, 0 queries in queue
	// 0 read views open inside InnoDB
	rQueries, _ := regexp.Compile(`(\d+) queries inside InnoDB, (\d+) queries in queue`)
	rViews, _ := regexp.Compile(`(\d+) read views open inside InnoDB`)

	for _, line := range strings.Split(statusCol, "\n") {
		if data := rQueries.FindStringSubmatch(line); data != nil {
			value, _ := strconv.ParseFloat(data[1], 64)
			ch <- prometheus.MustNewConstMetric(
				newDesc(innodb, "queries_inside_innodb", "Queries inside InnoDB."),
				prometheus.GaugeValue,
				value,
			)
			value, _ = strconv.ParseFloat(data[2], 64)
			ch <- prometheus.MustNewConstMetric(
				newDesc(innodb, "queries_in_queue", "Queries in queue."),
				prometheus.GaugeValue,
				value,
			)
		} else if data := rViews.FindStringSubmatch(line); data != nil {
			value, _ := strconv.ParseFloat(data[1], 64)
			ch <- prometheus.MustNewConstMetric(
				newDesc(innodb, "read_views_open_inside_innodb", "Read views open inside InnoDB."),
				prometheus.GaugeValue,
				value,
			)
		}
	}

	return nil
}
就如上面所说,使用正则表达式提取需要的信息。
本文到此结束。
此内容由惯性聚合(RSS阅读器)自动聚合整理,仅供阅读参考。 原文来自 — 版权归原作者所有。