



惯性聚合 高效追踪和阅读你感兴趣的博客、新闻、科技资讯
阅读原文 在惯性聚合中打开

推荐订阅源

宝玉的分享
宝玉的分享
Recent Commits to openclaw:main
钛媒体:引领未来商业与生活新知
钛媒体:引领未来商业与生活新知
T
Tailwind CSS Blog
Cyber Security Advisories - MS-ISAC
罗磊的独立博客
V
Visual Studio Blog
爱范儿
爱范儿
H
Help Net Security
J
Java Code Geeks
I
InfoQ
Recent Announcements
H
Hackread – Cybersecurity News, Data Breaches, AI and More
Recorded Future
Recorded Future
Jina AI
Jina AI
Microsoft Security Blog
WordPress大学
WordPress大学
GbyAI
GbyAI
freeCodeCamp Programming Tutorials: Python, JavaScript, Git & More
CTFtime.org: upcoming CTF events
Y
Y Combinator Blog
Google DeepMind News
Scott Helme
Scott Helme
S
SegmentFault 最新的问题
S
Securelist
L
LINUX DO - 热门话题
Cyberwarzone
Cyberwarzone
C
Cisco Blogs
Simon Willison's Weblog
G
Google Developers Blog
酷 壳 – CoolShell
酷 壳 – CoolShell
博客园 - 叶小钗
T
The Blog of Author Tim Ferriss
博客园_首页
B
Blog
F
Fortinet All Blogs
AWS News Blog
AWS News Blog
V
Vulnerabilities – Threatpost
S
Secure Thoughts
cs.AI updates on arXiv.org
Forbes - Security
Forbes - Security
S
Security @ Cisco Blogs
T
Threat Research - Cisco Blogs
OSCHINA 社区最新新闻
OSCHINA 社区最新新闻
S
Schneier on Security
Project Zero
Project Zero
Martin Fowler
Martin Fowler
C
Cybersecurity and Infrastructure Security Agency CISA
N
Netflix TechBlog - Medium
N
News and Events Feed by Topic

Jiajun的技术笔记

你好,2026! TiDB 源码阅读(六):TiDB Coprocessor 源码解析 性能优化的核心思想 TiDB 源码阅读(五):索引 TiDB 源码阅读(四):AST、逻辑计划、物理计划 CockroachDB Serverless Architecture podman 无故退出 Cursor Control-L (CTRL-L) Keyboard Shortcuts in Terminal Replace docker with podman Using xmonad with xfce4 A RC script for freebsd frpc 自己动手写一个k8s controller AI 会取代你的(编程)岗位吗? 自建DERP服务器提升Tailscale连接速度(使用Nginx转发) 自动升级Docker容器 再读《程序员修炼之道-从小工到专家》 让浏览器下载文件 再读《软件随想录》/《黑客与画家》/《软技能》 HTTP 压力测试中的 Coordinated Omission 2的补码 编程语言中的 context 是什么? flutter macOS 构建出错 Flatpak 使用小记 Golang CAS 操作是怎么实现的 PostgreSQL 当MQ来使用 Clash 结合 工作VPN 的网络设计 使用 PostgreSQL 搭建 JuiceFS PostgreSQL 配置优化和日志分析 有GitHub Copilot?那就可以搭建你的ChatGPT4服务 窗口函数的使用(以PG为例) 读《为什么学生不喜欢上学》 OpenAI Prompt Engineering 摘录和总结 读《打造真正的新产品》 VueJS 总结 Linux 自动挂载 alist 提供的webdav FreeBSD 使用 vm-bhyve 安装Debian虚拟机 FreeBSD 和 Linux 网卡聚合实现提速 GPT 帮我搞定了时区转换问题 长任务系统如何处理? macOS/Linux 编译 InputLeap 使用开源软KVM - synergy-core 解决 macOS 终端hostname一直变化问题 KVM 共享 Intel 集成显卡 PromQL 备忘 读《格鲁夫给经理人的第一课》 读《打开心智》 为什么要把复杂的联表操作拆成多个单表查询? 红包系统的设计 MySQL Index Condition Pushdown Optimization Go mod 简明教程 OpenWRT 使用 Android/iOS USB 网络 搭建旁路由 Golang gRPC 错误处理 编写可维护的单元测试代码 OAuth 2 详解(六):Authorization Code Flow with PKCE OAuth 2 详解(五):Device Authorization Flow OAuth 2 详解(三):Resource Owner Password Credentials Grant OAuth 2 详解(四):Client Credentials Flow OAuth 2 详解(二):Implict Grant Flow OAuth 2 详解(一):简介及 Authorization Code 模式 ElasticSearch 学习笔记 三种git流程以及发版模型 错误处理实践 权限模型(RBAC/ABAC) OIDC(OpenID Connect) 简介 任务队列简介 PostgreSQL 操作笔记 使用Drone CI构建CI/CD系统 Golang migrate 做数据库变更管理 使用PostgreSQL做搜索引擎 Nginx 源码阅读(三): 连接池、内存池 Nginx 源码阅读(二): 请求处理 Nginx 源码阅读(一): 启动流程 Go 泛型简明教程 KVM 显卡穿透给 Windows 使用 HTTP Router 处理 Telegram Bot 按钮回调 使用反射(reflect)对结构体赋值 GIN 是如何绑定参数的 你好 2022(2021 年终总结) 用Go导入大型CSV到PostgreSQL 使用 OpenWRT 搭建软路由 使用软KVM切换器 barrier 共享键鼠 SQL 防注入及原理 使用 gomock 测试 Go 代码 gevent不是黑魔法(二): gevent 实现 gevent不是黑魔法(一): greenlet 实现 用 entgo 替代 gorm 应用内使用crontab不是那么方便 单测时要不要 mock 数据库? Sentry 自建指南 用selenium完成自动化任务 用闲置的安卓手机做垃圾电话短信过滤 推荐三个时间管理工具 一次事故反思 当JS遇到uint64:JS整数溢出问题 SQLite3 存储以及ACID原理 Redis源码阅读:pub/sub实现 Redis源码阅读:zset实现 Redis源码阅读:bitmap 位图的运算 Redis源码阅读:set是怎么做交并集运算的?
程序员的MySQL手册(二): 监控与benchmark
Jiajun Huang · 2020-07-23 · via Jiajun的技术笔记

这一节我们主要讲解如何监控MySQL的性能数据,以及如何对MySQL进行压测。

使用Prometheus进行监控

MySQL的监控方案有很多,我们使用Prometheus来进行监测,首先要安装prometheus mysql exporter:

$ sudo apt install prometheus-mysqld-exporter

在MySQL中创建如下用户:

CREATE USER 'exporter'@'localhost' IDENTIFIED BY 'XXXXXXXX' WITH MAX_USER_CONNECTIONS 3;
GRANT PROCESS, REPLICATION CLIENT, SELECT ON *.* TO 'exporter'@'localhost';

修改 /etc/default/prometheus-mysqld-exporter 中的 DATA_SOURCE_NAME 连接串。

之后要在Prometheus中加上对该节点的配置,至于Prometheus本身的安装配置,可以参考其它教程,我们这一节只专注于Prometheus的 安装与配置。

  - job_name: 'mysql'
    static_configs:
    - targets: ['192.168.122.220:9104']
      labels:
        instance: 'debian.mysql'

再往Grafana上添加一个面板,之后就可以看到MySQL的性能数据了,如图:
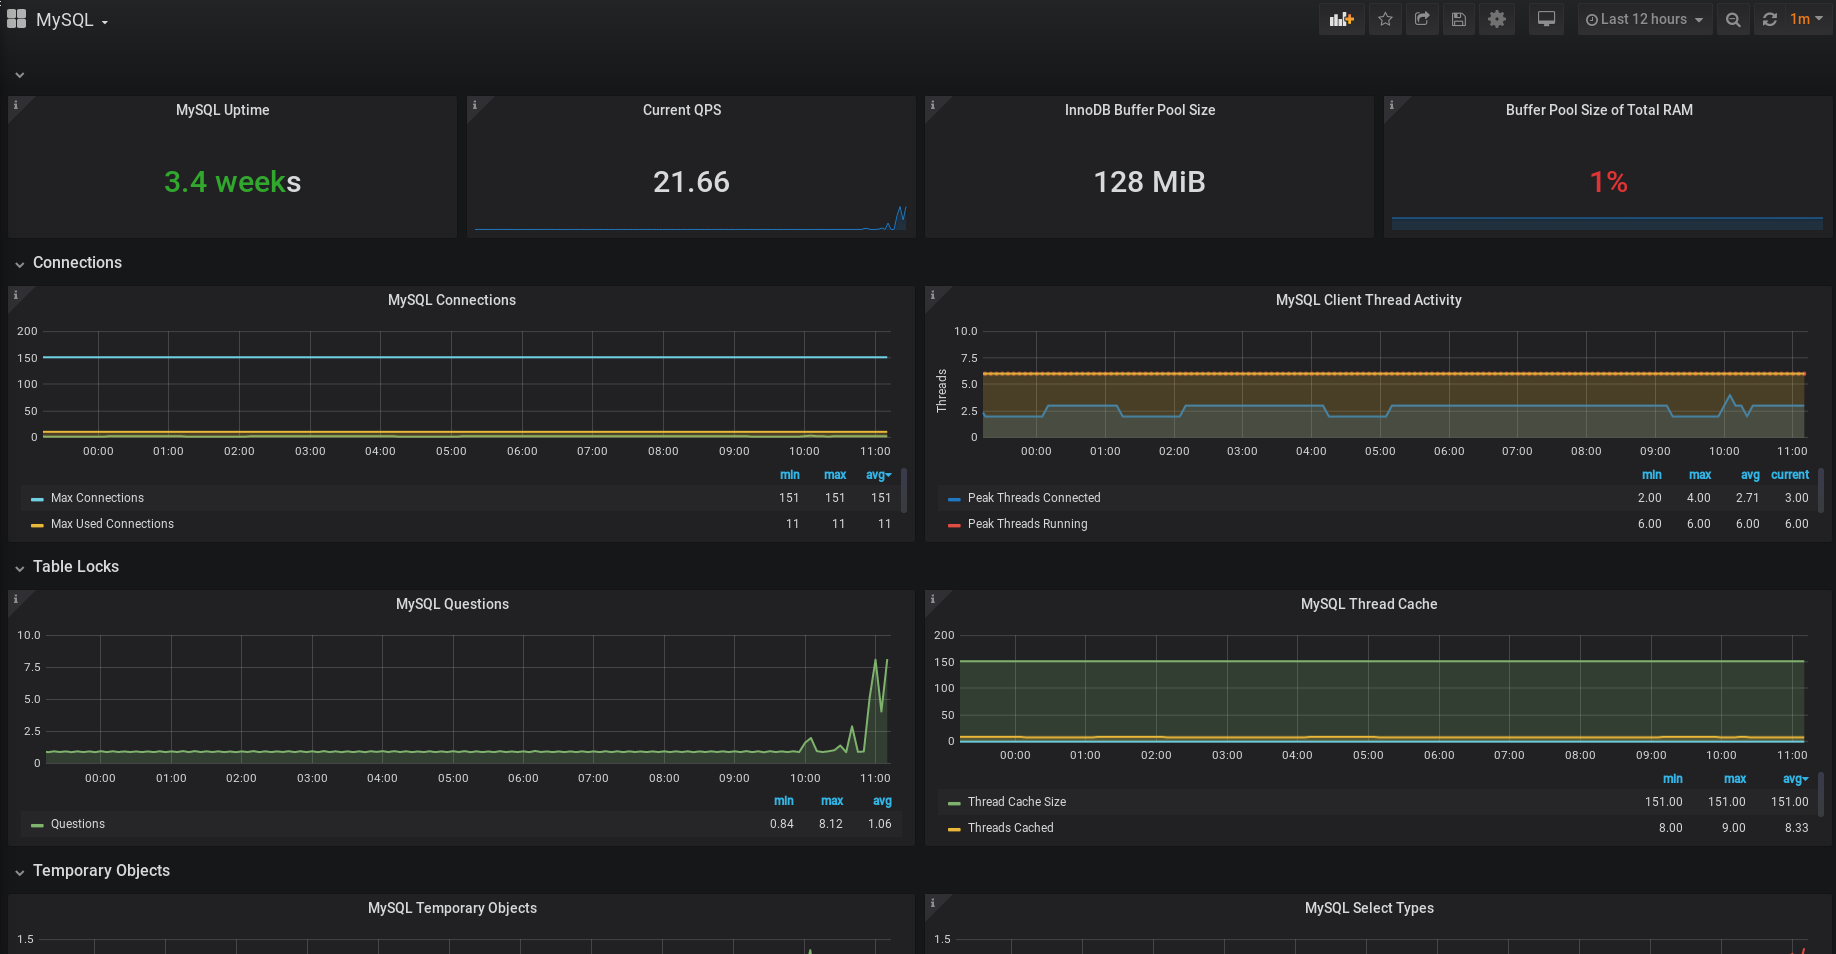
Grafana MySQL面板

sysbench对MySQL进行压测

这一节基本上可以算是一个简单的sysbench教程

sysbench 的基本用法是 sysbench <测试名称> <各类选项> 命令,其中命令包括 prepare run cleanup help version 这几个。而 测试名称,则包括 fileio, cpu, memory, threads, mutex,以及对数据库的一些测试脚本,他们在 /usr/share/sysbench/ 下, 例如如果要测试 oltp_insert.lua 就写为 oltp_insert 。

测试MySQL时,需要先准备一些数据,因此三个命令依次是 prepare, run, cleanup,依次是准备数据,执行测试,清除测试数据。 我们来看看实例。

$ sysbench oltp_insert --db-driver=mysql --mysql-host=127.0.0.1 --mysql-db=sbtest --mysql-user=root --mysql-password=new_password prepare
sysbench 1.0.18 (using system LuaJIT 2.1.0-beta3)

Creating table 'sbtest1'...
Inserting 10000 records into 'sbtest1'
Creating a secondary index on 'sbtest1'...
$ sysbench oltp_insert --db-driver=mysql --mysql-host=127.0.0.1 --mysql-db=sbtest --mysql-user=root --mysql-password=new_password run
sysbench 1.0.18 (using system LuaJIT 2.1.0-beta3)

Running the test with following options:
Number of threads: 1
Initializing random number generator from current time


Initializing worker threads...

Threads started!

SQL statistics:
    queries performed:
        read:                            0
        write:                           1909
        other:                           0
        total:                           1909
    transactions:                        1909   (190.76 per sec.)
    queries:                             1909   (190.76 per sec.)
    ignored errors:                      0      (0.00 per sec.)
    reconnects:                          0      (0.00 per sec.)

General statistics:
    total time:                          10.0039s
    total number of events:              1909

Latency (ms):
         min:                                    0.99
         avg:                                    5.23
         max:                                   21.17
         95th percentile:                        9.06
         sum:                                 9989.73

Threads fairness:
    events (avg/stddev):           1909.0000/0.00
    execution time (avg/stddev):   9.9897/0.00

$ sysbench oltp_insert --db-driver=mysql --mysql-host=127.0.0.1 --mysql-db=sbtest --mysql-user=root --mysql-password=new_password cleanup
sysbench 1.0.18 (using system LuaJIT 2.1.0-beta3)

Dropping table 'sbtest1'...

通过对对应部分的压测,我们可以得到一个大致的数据,即当前配置情况下,数据库实例大概能跑到一个什么样的情况。从而为之后的 变更(如数据库升级,数据库是否到了瓶颈)等提供一个参考数据。

总结

这篇文章中我们主要是搭建了Prometheus MySQL的监控,和学习使用了sysbench这个工具,从而可以得到一些数据库的基准数据,这个 数据可以为之后对数据库实例的使用作为参考。

系列目录: