


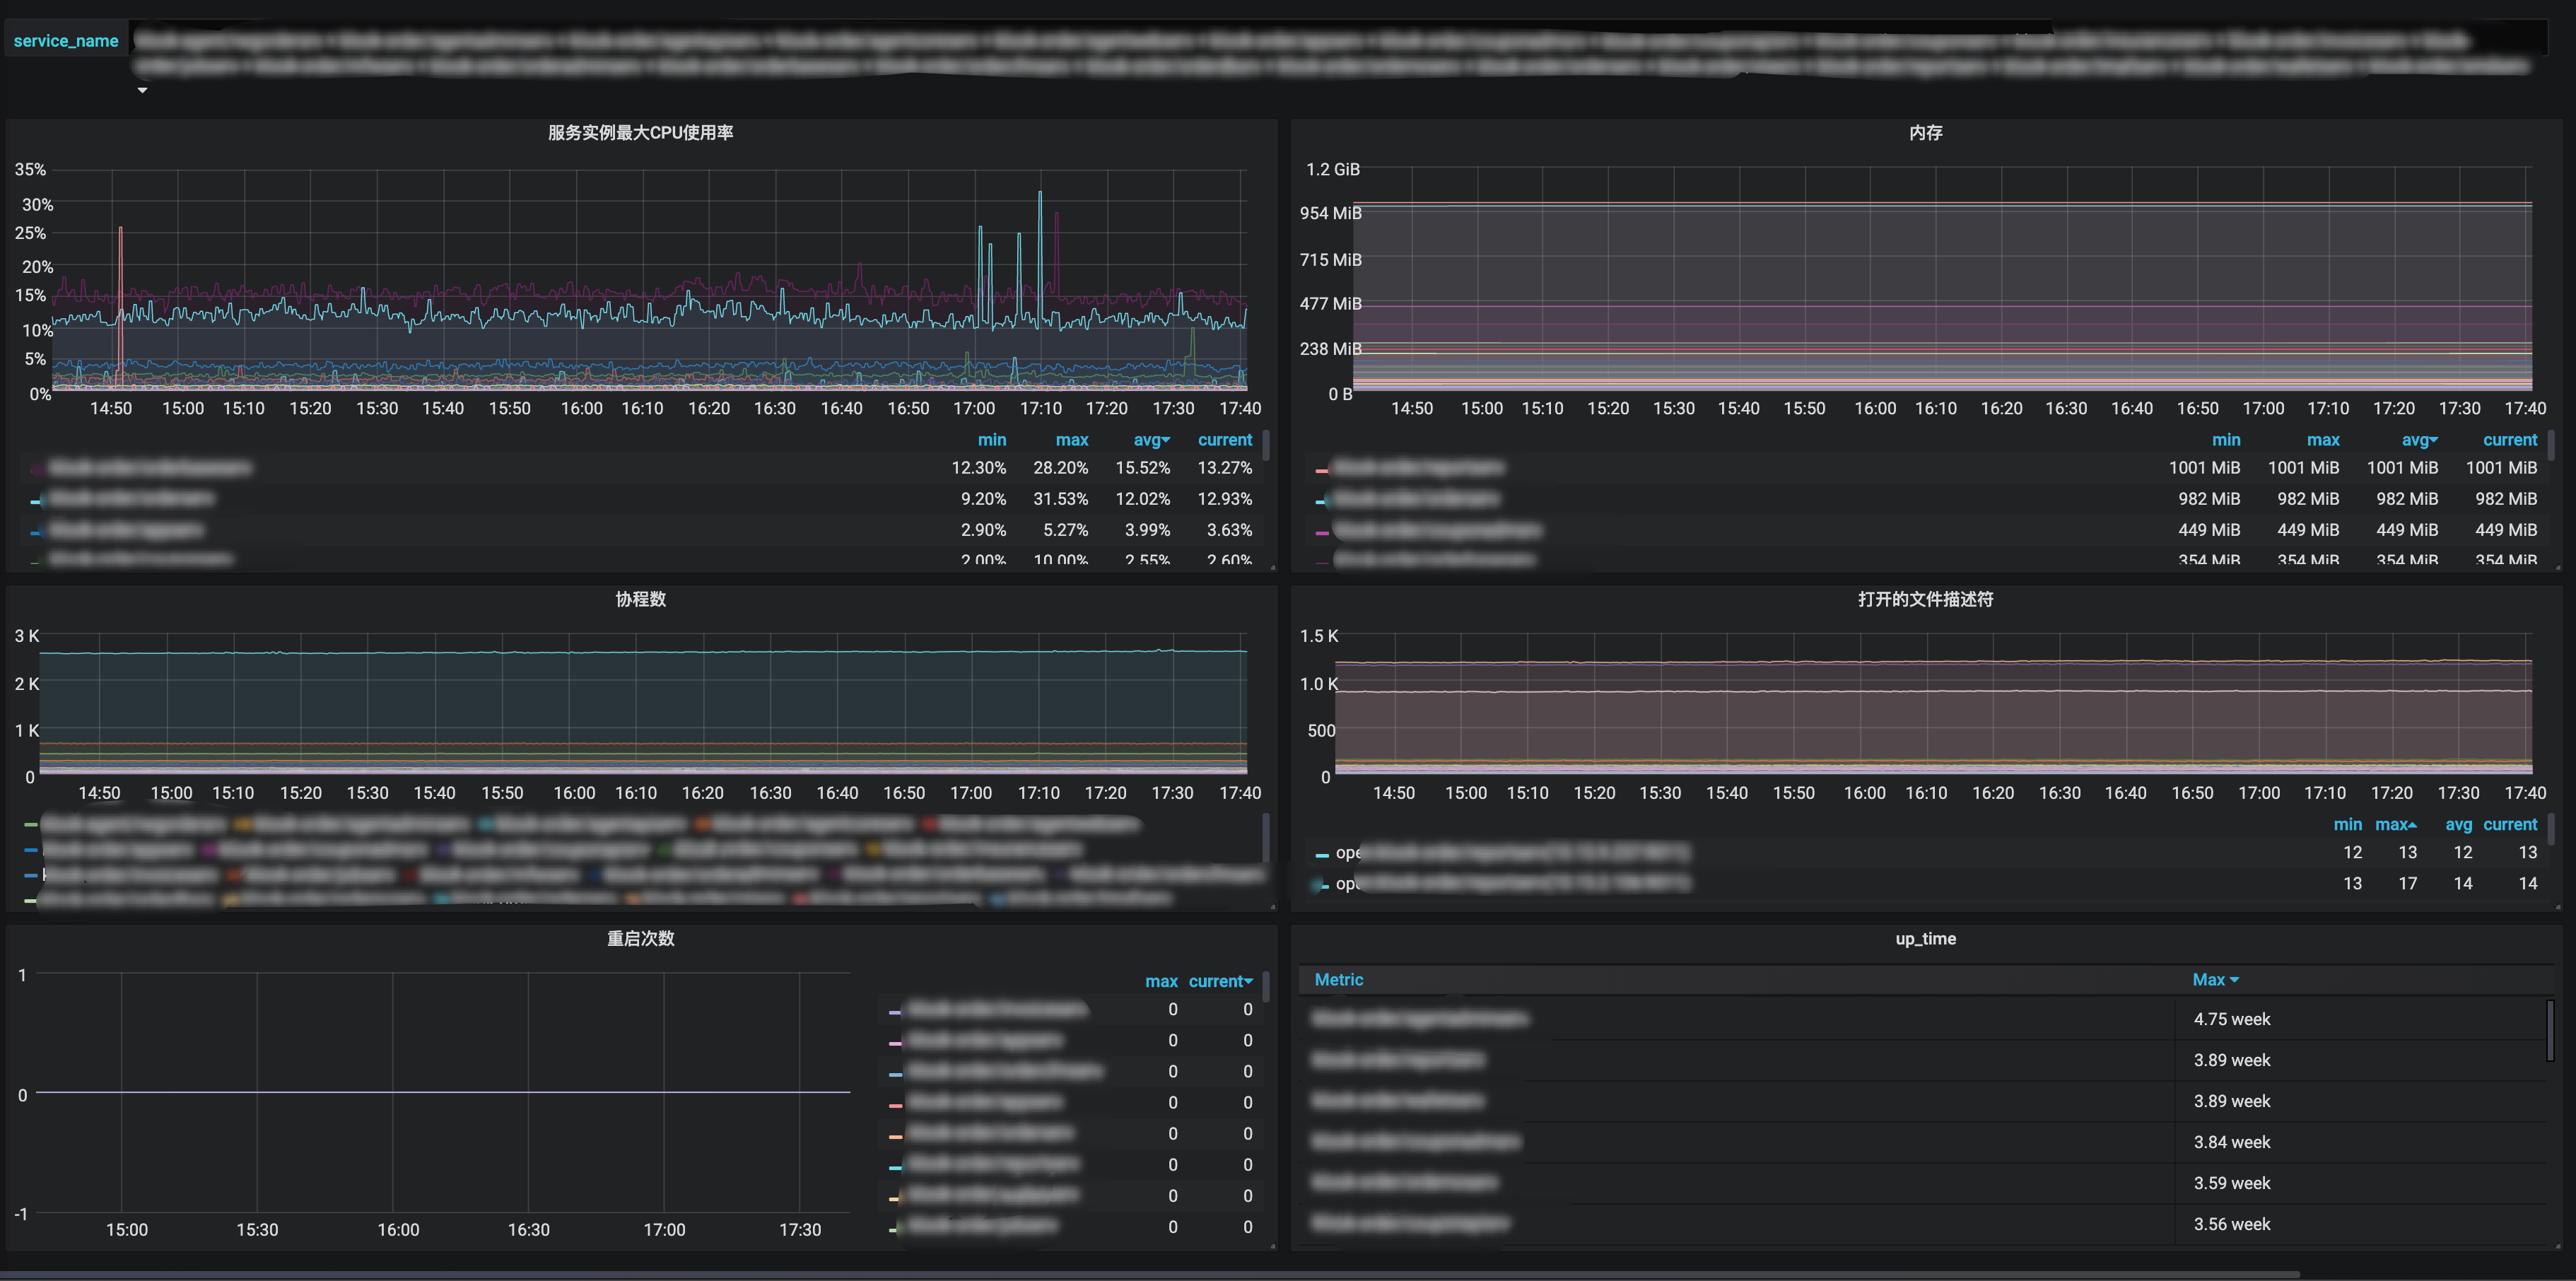
最近我对Prometheus刮目相看了, 服务加一行代码就能轻轻松松地监控起来服务的CPU使用率、内存、协程数、线程数、打开的文件描述符数量及软限制、重启次数等重要的基本指标, 配合Grafana建立了直观的图表, 对查问题很有帮助, 故想写写折腾Prometheus和Grafana后得到的值得一讲的实践与理解.
Prometheus是CNCF 的项目之一(ps.CNCF的项目代码都值得研究), 而且还是Graduated Projects. 同时因为其主要是方便灵活的pull方式, 暴露出个http接口出来给prometheusd拉取就行了, 而push方式客户端要做更多的事情, 如果要改push的地址的话就很麻烦, 所以很多著名的项目都在用它, 比如k8s, tidb, etcd, 甚至是时序数据库influxdb都在用它.
我体会到, 很多场景很适合使用Prometheus sdk去加一些指标, 比如logger包, Error级别的消息数是一个很有用的指标; 对于消息队列的SDK, 可以用Prometheus收集客户端侧的发送时延、消费时延、消费处理耗时、消费处理出错等指标; 封装DB操作的SDK, 连接池打开的DB连接数与最大连接数是个很重要的指标; 写个HTTP Middleware, http handler的调用次数、处理时间和responseCode是感兴趣的指标.
Prometheus是Go写的, 故部署方便且跨平台, 一个二进制文件加配置文件就能跑起来.
GitHub release页面有各个平台的编译好的二进制文件,通常配合supervisor等进程管理工具来服务化, 也可以用docker.
文档上有基础的配置文件示例, 复制为prometheus.yml即可.
./prometheus --config.file=prometheus.yml
prometheus.yml主要是定义一些全局的抓取间隔等参数以及抓取的job, 抓取的job可以指定名字、抓取间隔、抓取目标的IP端口号列表, 目标的路由路径, 额外的label等参数.
抓取指标时会自动加上job="<job_name>"和instance="<target ip port>"两个label, 如果想给job添加额外的固定label, 则可以在配置文件中按如下语法添加.
scrape_configs:
  - job_name: foo
    metrics_path: "/prometheus/metrics"
    static_configs:
      - targets: ['localhost:10056']
        labels:
          service_name: "bar"
前面说到, Prometheus的配置文件主要就是定义要抓取的job配置, 显然新加服务要改配置文件是比较麻烦的, Prometheus的一大重要的功能点就是原生支持多种服务发现方式, 支持consul etcd等服务发现组件, 还支持非常通用的基于文件的服务发现, 即你可以定义一个写好target的IP端口号等配置的配置文件路径, 由外部程序定期去更新这个文件, prometheus会定期加载它, 更新抓取的目标, 非常灵活.
Prometheus的时序指标数据由timestamp、metric name、label、value组成:
timestamp是毫秒级的时间戳.
metric name是符合正则[a-zA-Z_:][a-zA-Z0-9_:]*的字符串, 即只包含英文字母和数字及两个特殊符号_:, 不能包含横杆-这样的特殊符号.
label是一个kv都是string类型的map.
value是float64.
Prometheus的指标类型包括基本指标类型Counter和Guage及进阶指标类型Historygram和Summary.
所有指标都是在client SDK端内存存储的, 由prometheus抓取器抓取.
Counter是计数器, 单调递增的, 只有服务重启时才会清零, 比如http请求数, errorLevel的log数. 值得一提的是, prometheus的内置函数求值时会自动处理重启清零的情况.
counter的value是float64, 怎么无锁地操作float64呢? 答案是用math包将其视作uint64来操作.
func (v *value) Add(val float64) {
	for {
		oldBits := atomic.LoadUint64(&v.valBits)
		newBits := math.Float64bits(math.Float64frombits(oldBits) + val)
		if atomic.CompareAndSwapUint64(&v.valBits, oldBits, newBits) {
			return
		}
	}
}
Guage是一个可增可减的数值指标, 比如CPU使用率, 内存使用率, 协程数.
Historygram是直方图, 适合需要知道数值分布范围的场景, 比如http请求的响应时长, http请求的响应包体大小等.
直方图的组距不一定是固定的, 可以自己定义适合, 这里称其为bucket, 每一个metric value根据其数值大小落在对应的bucket.
Historygram实际上包含多个时序数据.
<basename>_bucket{le="<upper inclusive bound>"}小于等于指定数值的计数.<basename>_sum 总和<basename>_count 总计数, 其值当然也等于<basename>_bucket{le="+Inf"}Summary相比Historygram是按百分位聚合好的直方图, 适合需要知道百分比分布范围的场景, 比如对于 http请求的响应时长, Historygram是侧重在于统计小于1ms的请求有多少个, 1ms~10ms的请求有多少个, 10ms以上的请求有多少个, 而Summary在于统计20%的请求的响应时间是多少, 50%的请求的响应时间是多少, 99%的请求的响应时间是多少. Historygram是计数原始数据, 开销小, 执行查询时有对应的函数计算得到p50, p99, 而Summary是在客户端SDK测做了聚合计算得到指定的百分位, 开销更大一些.
prometheus的Golang SDK设计得很地道, 充分利用了GO语言的特性.
在SDK中所有的指标类型都实现了prometheus.Collector 接口.
// Collector is the interface implemented by anything that can be used by
// Prometheus to collect metrics. A Collector has to be registered for
// collection. See Registerer.Register.
//
// The stock metrics provided by this package (Gauge, Counter, Summary,
// Histogram, Untyped) are also Collectors (which only ever collect one metric,
// namely itself). An implementer of Collector may, however, collect multiple
// metrics in a coordinated fashion and/or create metrics on the fly. Examples
// for collectors already implemented in this library are the metric vectors
// (i.e. collection of multiple instances of the same Metric but with different
// label values) like GaugeVec or SummaryVec, and the ExpvarCollector.
type Collector interface {
	// Describe sends the super-set of all possible descriptors of metrics
	// collected by this Collector to the provided channel and returns once
	// the last descriptor has been sent. The sent descriptors fulfill the
	// consistency and uniqueness requirements described in the Desc
	// documentation. (It is valid if one and the same Collector sends
	// duplicate descriptors. Those duplicates are simply ignored. However,
	// two different Collectors must not send duplicate descriptors.) This
	// method idempotently sends the same descriptors throughout the
	// lifetime of the Collector. If a Collector encounters an error while
	// executing this method, it must send an invalid descriptor (created
	// with NewInvalidDesc) to signal the error to the registry.
	Describe(chan<- *Desc)
	// Collect is called by the Prometheus registry when collecting
	// metrics. The implementation sends each collected metric via the
	// provided channel and returns once the last metric has been sent. The
	// descriptor of each sent metric is one of those returned by
	// Describe. Returned metrics that share the same descriptor must differ
	// in their variable label values. This method may be called
	// concurrently and must therefore be implemented in a concurrency safe
	// way. Blocking occurs at the expense of total performance of rendering
	// all registered metrics. Ideally, Collector implementations support
	// concurrent readers.
	Collect(chan<- Metric)
}
prometheus.Collector 接口中的方法传参都是只写的chan, 使得实现接口的代码无论是同步还是并行都可以. Describe(chan<- *Desc)方法是在将Collector注册或注销时调用的, Collect(chan<- Metric)方法是在被抓取收集指标时调用的.
不带label的指标类型使用prometheus.NewCounter prometheus.NewGauge prometheus.NewHistogram prometheus.NewSummary去创建并使用prometheus.MustRegister 注册, 一般是初始化好作为一个包内全局变量, 在init函数中注册.
var (
	sentBytes = prometheus.NewCounter(prometheus.CounterOpts{
		Namespace: "etcd",
		Subsystem: "network",
		Name:      "client_grpc_sent_bytes_total",
		Help:      "The total number of bytes sent to grpc clients.",
	})

	receivedBytes = prometheus.NewCounter(prometheus.CounterOpts{
		Namespace: "etcd",
		Subsystem: "network",
		Name:      "client_grpc_received_bytes_total",
		Help:      "The total number of bytes received from grpc clients.",
	})
)

func init() {
	prometheus.MustRegister(sentBytes)
	prometheus.MustRegister(receivedBytes)
}
counter的Add方法不能传负数, 否则会panic.
带label的指标类型使用prometheus.NewCounterVec prometheus.NewGaugeVec prometheus.NewHistogramVec prometheus.NewSummaryVec, 不同的label值就像空间直角坐标系中的以原点为七点的不同方向的向量一样.
调用Vec类型的WithLabelValues方法传入的value参数数量一定要和注册时定义的label数量一致, 否则会panic.
默认情况下, Collector都是主动去计数, 但有的指标无法主动计数, 比如监控服务当前打开的DB连接数, 这个指标更适合在拉取指标时去获取值, 这个时候就可以使用prometheus.NewCounterFunc prometheus.NewGaugeFunc, 传入一个返回指标值的函数func() float64, 在拉取指标时就会调用这个函数, 当然, 这样定义的是没有带Label的, 如果想在拉取指标时执行自己定义的函数并且附加上label, 就只能自己定义一个实现 prometheus.Collector接口的指标收集器, prometheus SDK设计得足够灵活, 暴露了底层方法MustNewConstMetric, 使得可以很方便地实现一个这样的自定义Collector, 代码如下.
type gaugeVecFuncCollector struct {
	desc                        *prometheus.Desc
	gaugeVecFuncWithLabelValues []gaugeVecFuncWithLabelValues
	labelsDeduplicatedMap       map[string]bool
}

// NewGaugeVecFunc
func NewGaugeVecFunc(opts GaugeOpts, labelNames []string) *gaugeVecFuncCollector {
	return &gaugeVecFuncCollector{
		desc: prometheus.NewDesc(
			prometheus.BuildFQName(opts.Namespace, opts.Subsystem, opts.Name),
			opts.Help,
			labelNames,
			opts.ConstLabels,
		),
		labelsDeduplicatedMap: make(map[string]bool),
	}
}

// Describe
func (dc *gaugeVecFuncCollector) Describe(ch chan<- *prometheus.Desc) {
	ch <- dc.desc
}

// Collect
func (dc *gaugeVecFuncCollector) Collect(ch chan<- prometheus.Metric) {
	for _, v := range dc.gaugeVecFuncWithLabelValues {
		ch <- prometheus.MustNewConstMetric(dc.desc, prometheus.GaugeValue, v.gaugeVecFunc(), v.labelValues...)
	}
}

// RegisterGaugeVecFunc
// 同一组labelValues只能注册一次
func (dc *gaugeVecFuncCollector) RegisterGaugeVecFunc(labelValues []string, gaugeVecFunc func() float64) (err error) {
	// prometheus每次允许收集一次labelValues相同的metric
	deduplicateKey := strings.Join(labelValues, "")
	if dc.labelsDeduplicatedMap[deduplicateKey] {
		return fmt.Errorf("labelValues func already registered, labelValues:%v", labelValues)
	}
	dc.labelsDeduplicatedMap[deduplicateKey] = true
	handlePanicGaugeVecFunc := func() float64 {
		if rec := recover(); rec != nil {
			const size = 10 * 1024
			buf := make([]byte, size)
			buf = buf[:runtime.Stack(buf, false)]
			logger.Errorf("gaugeVecFunc panic:%v\nstack:%s", rec, buf)
		}
		return gaugeVecFunc()
	}
	dc.gaugeVecFuncWithLabelValues = append(dc.gaugeVecFuncWithLabelValues, gaugeVecFuncWithLabelValues{
		gaugeVecFunc: handlePanicGaugeVecFunc,
		labelValues:  labelValues,
	})
	return nil
}
在编辑图表写查询语句时,不会显示指标类型, 所以最好看到metric name就能知道是一个什么类型的指标, 约定counter类型的指标名字以_total为后缀.
在编辑图表写查询语句时, 也不会显示指标类型的单位, 所以最好看到metric name就能知道是一个什么单位的指标, 比如时长要写是纳秒还是毫秒还是秒, http_request_duration_seconds, 数据大小要写是MB还是bytes, client_grpc_sent_bytes_total.
每个指标要有单个词的namespace前缀, 比如process_cpu_seconds_total, http_request_duration_seconds.
不带label的Counter和Guage内部是个无锁的atomic uint64, 不带Label的Historygram内部是多个无锁的atomic uint64, 不带Label的Summary因为内部要聚合计算, 是有锁的, 所以并发要求高的话优先选择Historygram而不是Summary.
带label的每次会去计算label值的hash找到对应的向量, 然后去计数, 所以label数不要太多, label值的长度不要太长, label值是要可枚举的并且不能太多, 否则执行查询时慢, 面板加载慢, 存储也费空间. label如果可以提前计算则尽量使用GetMetricWithLabelValues提前计算好得到一个普通的计数器, 减少每次计数的一次计算label的hash, 提升程序性能.
// GetMetricWithLabelValues replaces the method of the same name in
// MetricVec. The difference is that this method returns a Counter and not a
// Metric so that no type conversion is required.
func (m *CounterVec) GetMetricWithLabelValues(lvs ...string) (Counter, error) {
   metric, err := m.MetricVec.GetMetricWithLabelValues(lvs...)
   if metric != nil {
      return metric.(Counter), err
   }
   return nil, err
}
对于时长time.Duration数据类型的指标值收集, time.Since是优化过的, 直接走runtimeNano, 无需走系统调用取当前时间, 性能优于time.Now后相减, 另外, 频繁调用time.Now在性能要求高的程序中也会变成不小的开销.
Prometheus查询语句(PromQL)是一个相比SQL更简单也很有表达力的专用查询语言, 通过文档及例子学习.
Prometheus自带的Graph面板比较简陋, 一般情况下直接用强大的Grafana就行了, 制作图表dashboard时, 直接输入PromQL即可展示时序图表.
http_requests_total{job="prometheus",group="canary"}
查询条件中,除了=和!=外, =~表示正则匹配, !~表示正则不匹配.
查询条件也可以作用在metric name上, 语法有点像Python的__前缀的魔法, 如用 {__name__=~"job:.*"}表示选择名字符合job:.*这样的正则的metric.
http_requests_total{job="prometheus"}[5m]
范围条件中, 时长字符串语法和GO一样, s代表秒, m代表分, h代表小时, d代表天, w代表星期, y代表年.
changes() 变化次数delta(v range-vector) 平均变化量, 只适用于guageidelta(v range-vector) 即时变化量, 只适用于guagehistogram_quantile(φ float, b instant-vector) histogram专用函数, 用来计算p99 p90等百分位的summary. 例子histogram_quantile(0.9, avg(rate(http_request_duration_seconds_bucket[10m])) by (job, le))increase(v range-vector) 增量, 只适用于counterrate - 平均QPSirate - 即时QPS, 如果原始数据变化快, 可以使用更敏感的irate这里列举一些我通过搜索及自行摸索出来的对于Prometheus GO SDK默认收集的指标的PromQL Snippet.
CPU使用率: rate(process_cpu_seconds_total[1m])* 100
系统内存使用率: go_memstats_sys_bytes
重启次数: changes(process_start_time_seconds[5m])
编辑Grafana面板时, 有几个技巧:
告警在Grafana处可视化界面设置会比较简单, 可设置连续多少次指定的promQL查出的值不在指定的范围即触发报警, 告警通知的最佳搭配当然是slack channel.
此内容由惯性聚合(RSS阅读器)自动聚合整理,仅供阅读参考。 原文来自 — 版权归原作者所有。