


这个系列是我通过阅读 Scikit-learn 的文档,结合自己的理解和掌握的知识,重新把文档描述出来。希望能加深自己的理解,希望能帮到有需要的人。
学习材料:https://scikit-learn.org/stable/tutorial/statistical_inference/index.html
Scikit-learn 能处理的数据集都必须是2维矩阵,第一维是列举了所有的观察值,第二维则是每个观察值的多个特征(比如下面矩阵中的 $f_n$ 就是每个数据样本的第 $n$ 个特征)。
$$ \underbrace{ \begin{bmatrix} \begin{pmatrix} f_1 \\ f_2 \\ f_3 \\ f_4 \\ \end{pmatrix} & \begin{pmatrix} f_1 \\ f_2 \\ f_3 \\ f_4 \\ \end{pmatrix} & \begin{pmatrix} f_1 \\ f_2 \\ f_3 \\ f_4 \\ \end{pmatrix} & \cdots \begin{pmatrix} f_1 \\ f_2 \\ f_3 \\ f_4 \\ \end{pmatrix} & \end{bmatrix}}_{\text{samples}} $$
Scikit-learn 自带的 iris 数据(鸢尾花数据集),它包含了150个样本,每个样本体现了4方面特征,是一个 $150 \times 4$ 的二维矩阵。
>>> from sklearn import datasets
>>> iris = datasets.load_iris()
>>> iris.data.shape
(150, 4)
>>> iris.data[:10]
array([[5.1, 3.5, 1.4, 0.2],
       [4.9, 3. , 1.4, 0.2],
       [4.7, 3.2, 1.3, 0.2],
       [4.6, 3.1, 1.5, 0.2],
       [5. , 3.6, 1.4, 0.2],
       [5.4, 3.9, 1.7, 0.4],
       [4.6, 3.4, 1.4, 0.3],
       [5. , 3.4, 1.5, 0.2],
       [4.4, 2.9, 1.4, 0.2],
       [4.9, 3.1, 1.5, 0.1]])
>>>
库里自带了对数据的描述,摘录如下:
Data Set Characteristics:
:Number of Instances: 150 (50 in each of three classes)
:Number of Attributes: 4 numeric, predictive attributes and the class
:Attribute Information:
    - sepal length in cm
    - sepal width in cm
    - petal length in cm
    - petal width in cm
    - class:
            - Iris-Setosa
            - Iris-Versicolour
            - Iris-Virginica

:Summary Statistics:

============== ==== ==== ======= ===== ====================
                Min  Max   Mean    SD   Class Correlation
============== ==== ==== ======= ===== ====================
sepal length:   4.3  7.9   5.84   0.83    0.7826
sepal width:    2.0  4.4   3.05   0.43   -0.4194
petal length:   1.0  6.9   3.76   1.76    0.9490  (high!)
petal width:    0.1  2.5   1.20   0.76    0.9565  (high!)
============== ==== ==== ======= ===== ====================

:Missing Attribute Values: None
:Class Distribution: 33.3% for each of 3 classes.
:Creator: R.A. Fisher
:Donor: Michael Marshall (MARSHALL%PLU@io.arc.nasa.gov)
:Date: July, 1988
The famous Iris database, first used by Sir R.A. Fisher. The dataset is taken from Fisher’s paper. Note that it’s the same as in R, but not as in the UCI Machine Learning Repository, which has two wrong data points.
This is perhaps the best known database to be found in the pattern recognition literature. Fisher’s paper is a classic in the field and is referenced frequently to this day. (See Duda & Hart, for example.) The data set contains 3 classes of 50 instances each, where each class refers to a type of iris plant. One class is linearly separable from the other 2; the latter are NOT linearly separable from each other.
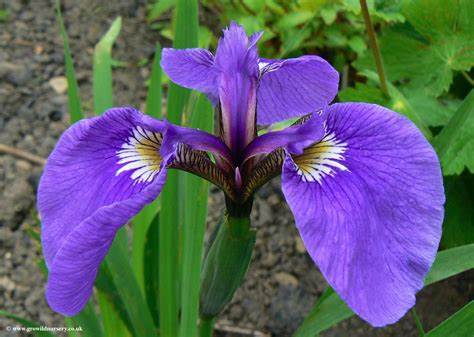
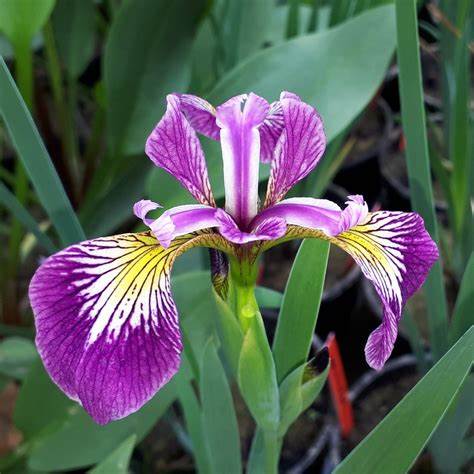
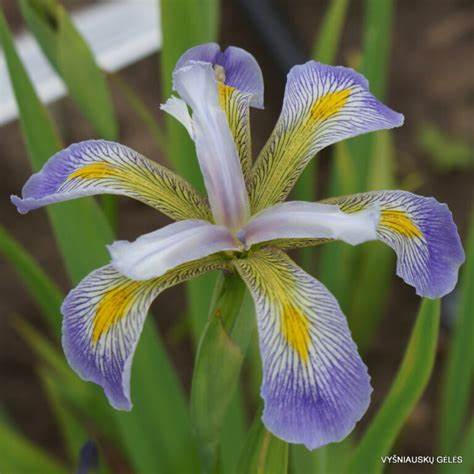
著名的鸢尾花数据集,由英国统计与遗传学家 R.A. Fisher 爵士首次提出。现今是模式识别领域中最知名的数据集。这个数据集包括来自三种鸢尾花:
Iris Setosa(山鸢尾)
Iris Versicolour(杂色鸢尾)
Iris Virginica(维吉尼亚鸢尾)
150 朵鸢尾花的数据来自以上三种每种 50 朵。每条数据描述花的4个特征:4个特征(花萼长度,花萼宽度,花瓣长度,花瓣宽度),都量化为数字形式。
三种花的数据中,其中有一种数据可以以线性分类的方法区分出来,但是另外两种则不能线性相互拆分开。
Scikit-learn 自带多种的估计器,用来完成机器学习的各种任务:
估计器的输入是原始的数据(raw data),根据估计器任务类型的不同,输出的结果可能是分类的标签、回归的参数、聚类的结果。
所有的估计器都有 .fit() 接口用于输入数据、学习数据。
如果要给估计器设定参数,可以在实例化的时候指定:
estimator = Estimator(param1=1, param2=2)
>>> estimator.param1
1
学习成果:
当数据集送入估计器的 .fit() 接口后,估计的参数就可以从估计器对象的属性读取得到。要注意的是,属性名称是以下划线结尾的。
>>> estimator.estimated_param_
各位读后有什么想法,请在下方留言吧!如果对本文有疑问或者寻求合作,欢迎 联系邮箱 。邮箱已到剪贴板
此内容由惯性聚合(RSS阅读器)自动聚合整理,仅供阅读参考。 原文来自 — 版权归原作者所有。