惯性聚合 高效追踪和阅读你感兴趣的博客、新闻、科技资讯
阅读原文 在惯性聚合中打开

推荐订阅源

酷 壳 – CoolShell
酷 壳 – CoolShell
H
Hacker News: Front Page
P
Palo Alto Networks Blog
T
ThreatConnect
Apple Machine Learning Research
博客园_首页
T
True Tiger Recordings
P
Privacy & Cybersecurity Law Blog
B
Blog
IT之家
IT之家
Last Week in AI
Last Week in AI
F
Full Disclosure
Hacker News: Ask HN
Hacker News: Ask HN
C
Comments on: Blog
Microsoft Azure Blog
C
Cybersecurity and Infrastructure Security Agency CISA
Microsoft Security Blog
博客园 - 【当耐特】
N
News and Events Feed by Topic
NISL@THU
NISL@THU
腾讯CDC
雷峰网
雷峰网
Security Latest
Security Latest
李成银的技术随笔
M
Microsoft Research Blog - Microsoft Research
L
LangChain Blog
L
Lohrmann on Cybersecurity
cs.CL updates on arXiv.org
C
Check Point Blog
Y
Y Combinator Blog
Recent Announcements
博客园 - Franky
N
News | PayPal Newsroom
V
V2EX
A
About on SuperTechFans
The Register - Security
月光博客
月光博客
奇客Solidot–传递最新科技情报
奇客Solidot–传递最新科技情报
Google Online Security Blog
MyScale Blog
MyScale Blog
Cisco Talos Blog
Cisco Talos Blog
Vercel News
Vercel News
WordPress大学
WordPress大学
C
Cyber Attacks, Cyber Crime and Cyber Security
The Hacker News
The Hacker News
IntelliJ IDEA : IntelliJ IDEA – the Leading IDE for Professional Development in Java and Kotlin | The JetBrains Blog
爱范儿
爱范儿
A
Arctic Wolf
L
LINUX DO - 最新话题
freeCodeCamp Programming Tutorials: Python, JavaScript, Git & More

GeekPlux

一代人的博客,一代人的青春注脚 那些年我打过的日结工 来美国的两年后 2023 一蓑烟雨 在美国拥有一辆 Tesla 的成本 我的 Workspaces 十年进化史 How to Sync Logseq Plugins, Themes and Settings Across Multiple Devices Setting Up Umami as Your Google Analytics Alternative: A Step-by-Step Guide 迁移豆瓣读书记录到 goodreads Enhance Your Internet Privacy in 2023 Refactor your blog comments system with Webmention.io 来美国之后,如何快速安顿下来 Three Levels of Information Perception 疫情三年 与人聊天的美好 我获取信息的方法 2022 版 我是如何学会编程的 Legacy code best practice: how to take over an existing project smoothly 2020 恍如隔世 接外包的一些坑和小技巧 论交友 往返香港隔离指南 即将失明,还能继续做程序员吗 小谈我对新技术的态度 How to use tailwindcss with AMP in a Next.js project 远程工作如何提高效率 复式记账、财报、量化与图论 我为什么从阿里巴巴离职 2019 柳暗花明 YouTube 观看历史数据分析 投资被动型指数基金正在造成下一次金融泡沫? 三种主流的网赚套利,躺着赚钱? 色盲的世界 我是如何管理 21 张信用卡的 薅羊毛的最大意义:保持对规则的敏感度 来香港的两个月 数据可视化技术实现的关键点 不需要扫描仪,数字化归档自己的文件 如何找到时薪 80 美元的远程工作(二) 如何找到时薪 80 美元的远程工作(一) 如何打造真正的简历 浅思图数据可视化 舍本逐末的学习方式 给想转行作程序员的人泼一盆冷水 算法优化人生之 —— 调度算法 杭州最适合闲来溜达的几条路线 2018 平淡无奇 突闻金庸先生逝世有感 十年博客折腾历史 数据可视化之 Sankey 桑基图的实现 研究生生涯总结 如何在不规则多边形内均匀撒点的算法 Web 前端中的增强现实(AR)开发技术 参加 Google Summer of Code 的体验 如何在 GitHub 上获得数百 stars Markvis - 在 markdown 中生成可视化图表 D3 force layout and WebGL integration 文本数据可视化(下)——一图胜千言 文本数据可视化(上)——从 Wordle 谈起 我获取信息的渠道 数据可视化基础——视觉编码 数据可视化基础——数据模型 数据可视化基础——可视化流程 为什么要用 Emacs Vega-Lite: A Grammar of Interactive Graphics 如何搭建一个私人网盘 如何阅读一篇学术论文 超过十个人的微信群根本没有价值 毕业后的两年 建立索引式的学习方法 为什么我喜欢写代码 写文章的小技巧 为什么文章写得好的人都很厉害 人总要有点盲目的自信 如何管理好自己的密码 Backbone View 之间通信的三种方式 Vim - 适合自己的,才是最好的 轻松玩转 Ukulele 告别社交网络有多难 双拼学习记 CoffeeScript 编码风格指南(译) CoffeeScript 笔记 CSS 最核心的几个概念 响应式设计简易指南(译) 初识 TDD Collapsing margins——合并的外边距 菜鸟级 Mac 配置(二) 菜鸟级 Mac 配置(一) CSS 编写原则 Goodbye,我的大学 如何新建一个 Cocos2d-x 项目 Windows8.1 下 Cocos2d-x 环境搭建 Android 开发如何入门 如何绑定独立域名 写博客就用 FarBox 尝试改变微信公众账号消息的推送方式 情似流水 操作系统总结——存储器管理 操作系统总结——处理机管理 操作系统总结——引论
netjsongraph.js – Google Summer of Code (GSoC) 2017 summary
GeekPlux · 2017-08-26 · via GeekPlux

netjsongraph.js – Google Summer of Code (GSoC) 2017 summary

Link on medium

Throughout the last three months, I was quite fortunate to work for Freifunk on netjsongraph.js under the guidance of my mentor Federico Capoano. Thanks for this invaluable experience that I learned a lot of knowledge and use them in a practical project. Here is a summary of the work I have done during the Google Summer of Code (GSoC) 2017.
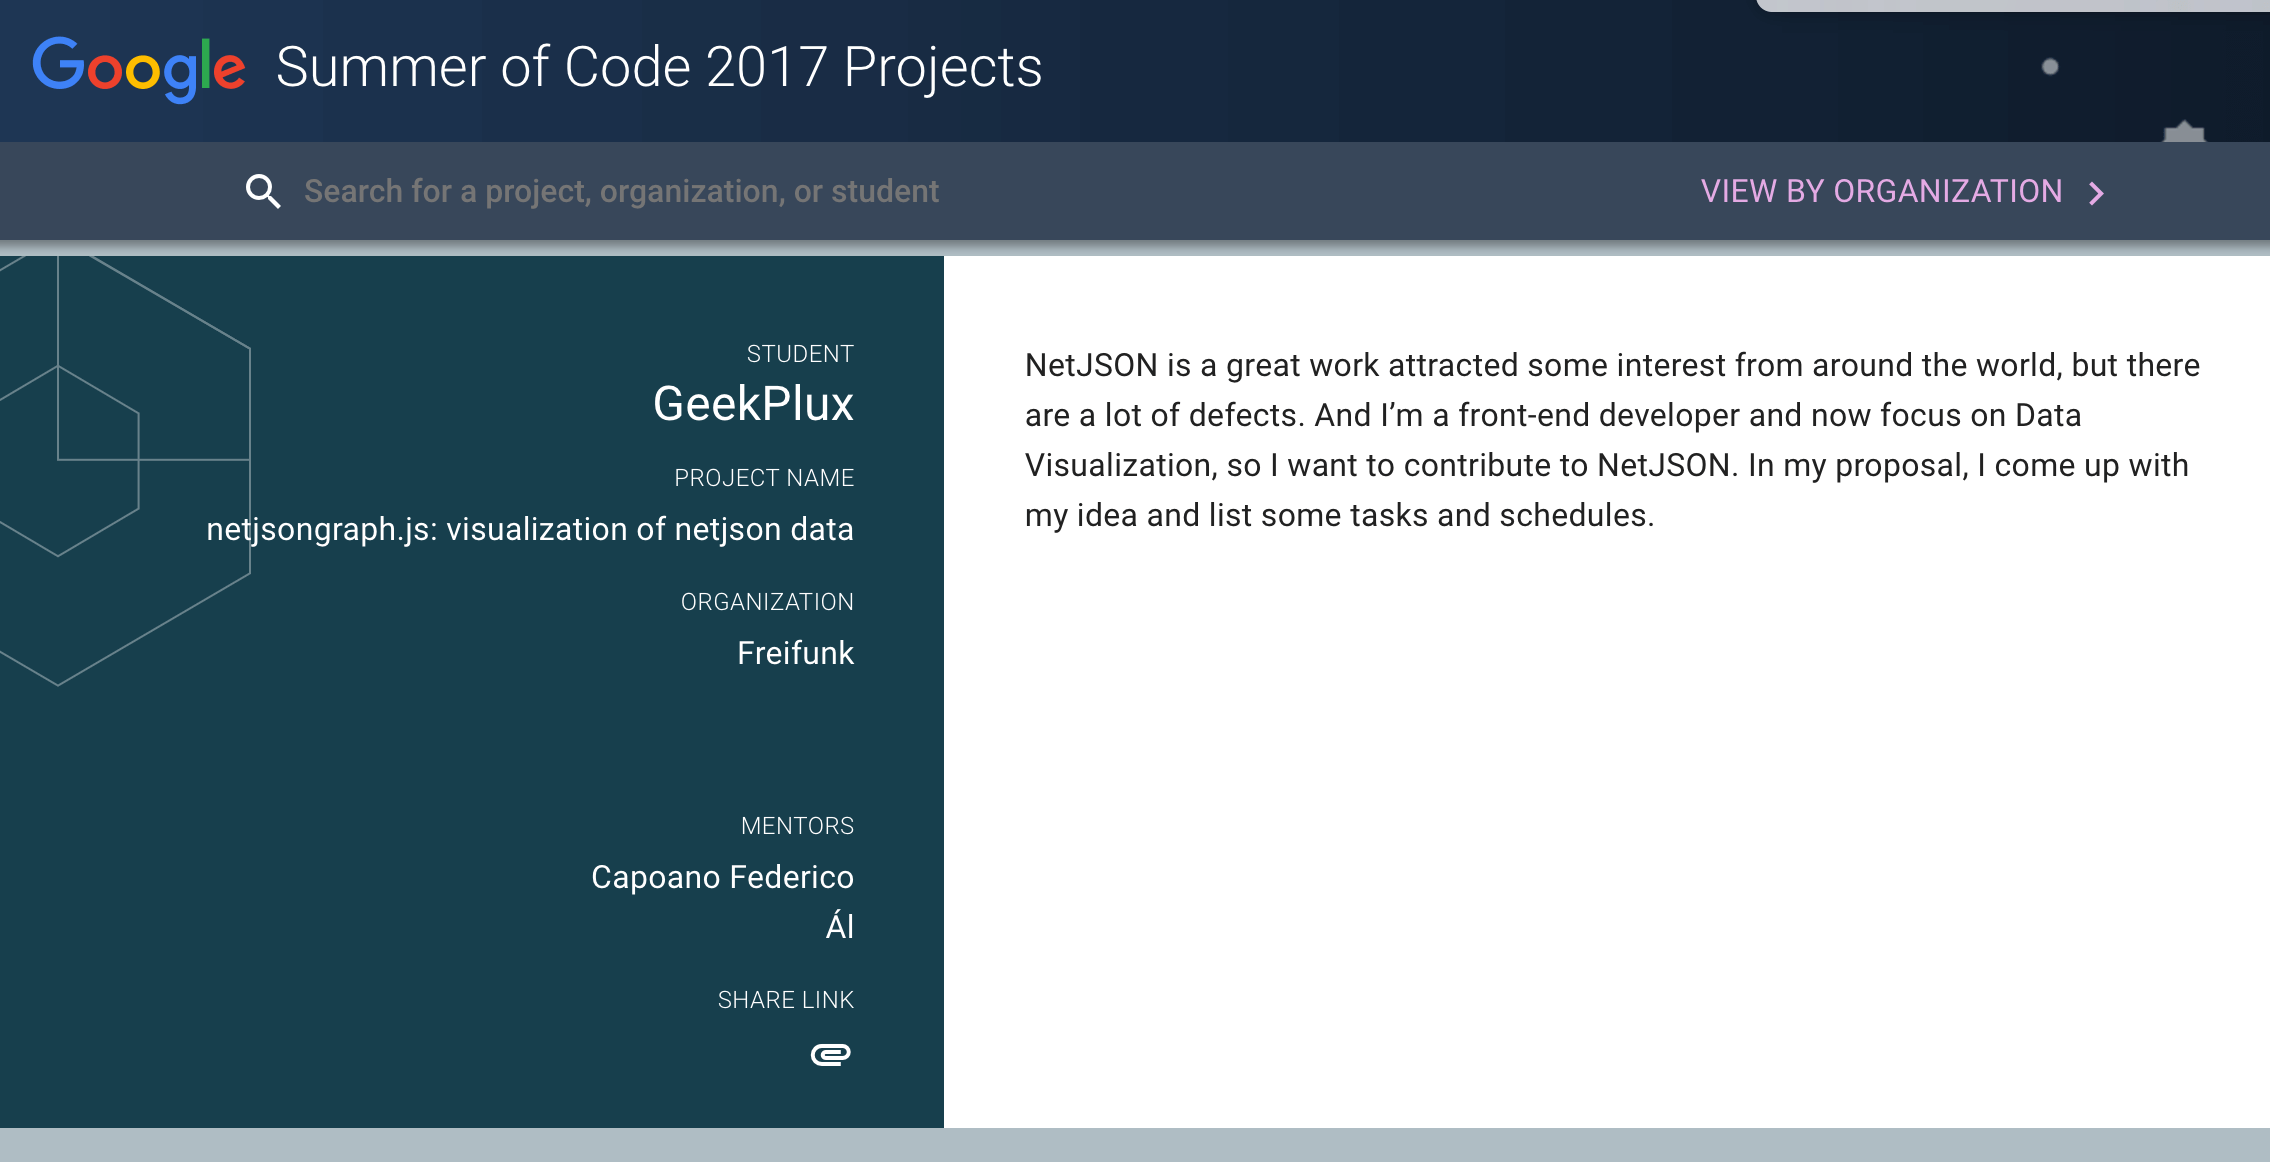
Google Summer of Code project page

Goal

netjsongraph.js is a visualization library for NetJSON, a network topology data format. The main goal of netjsongraph.js may be concluded in below three lines (more details you can see in GSoC 2017-netjsongraph.js: visualization of NetJSON data):

  • Apply the modern front-end development tools and add tests workflow (#1, #45)
  • Rewrite it with WebGL (#11, #29, #39, #42, #47)
  • Improve the performance (#41, #44, #46)

Achievement

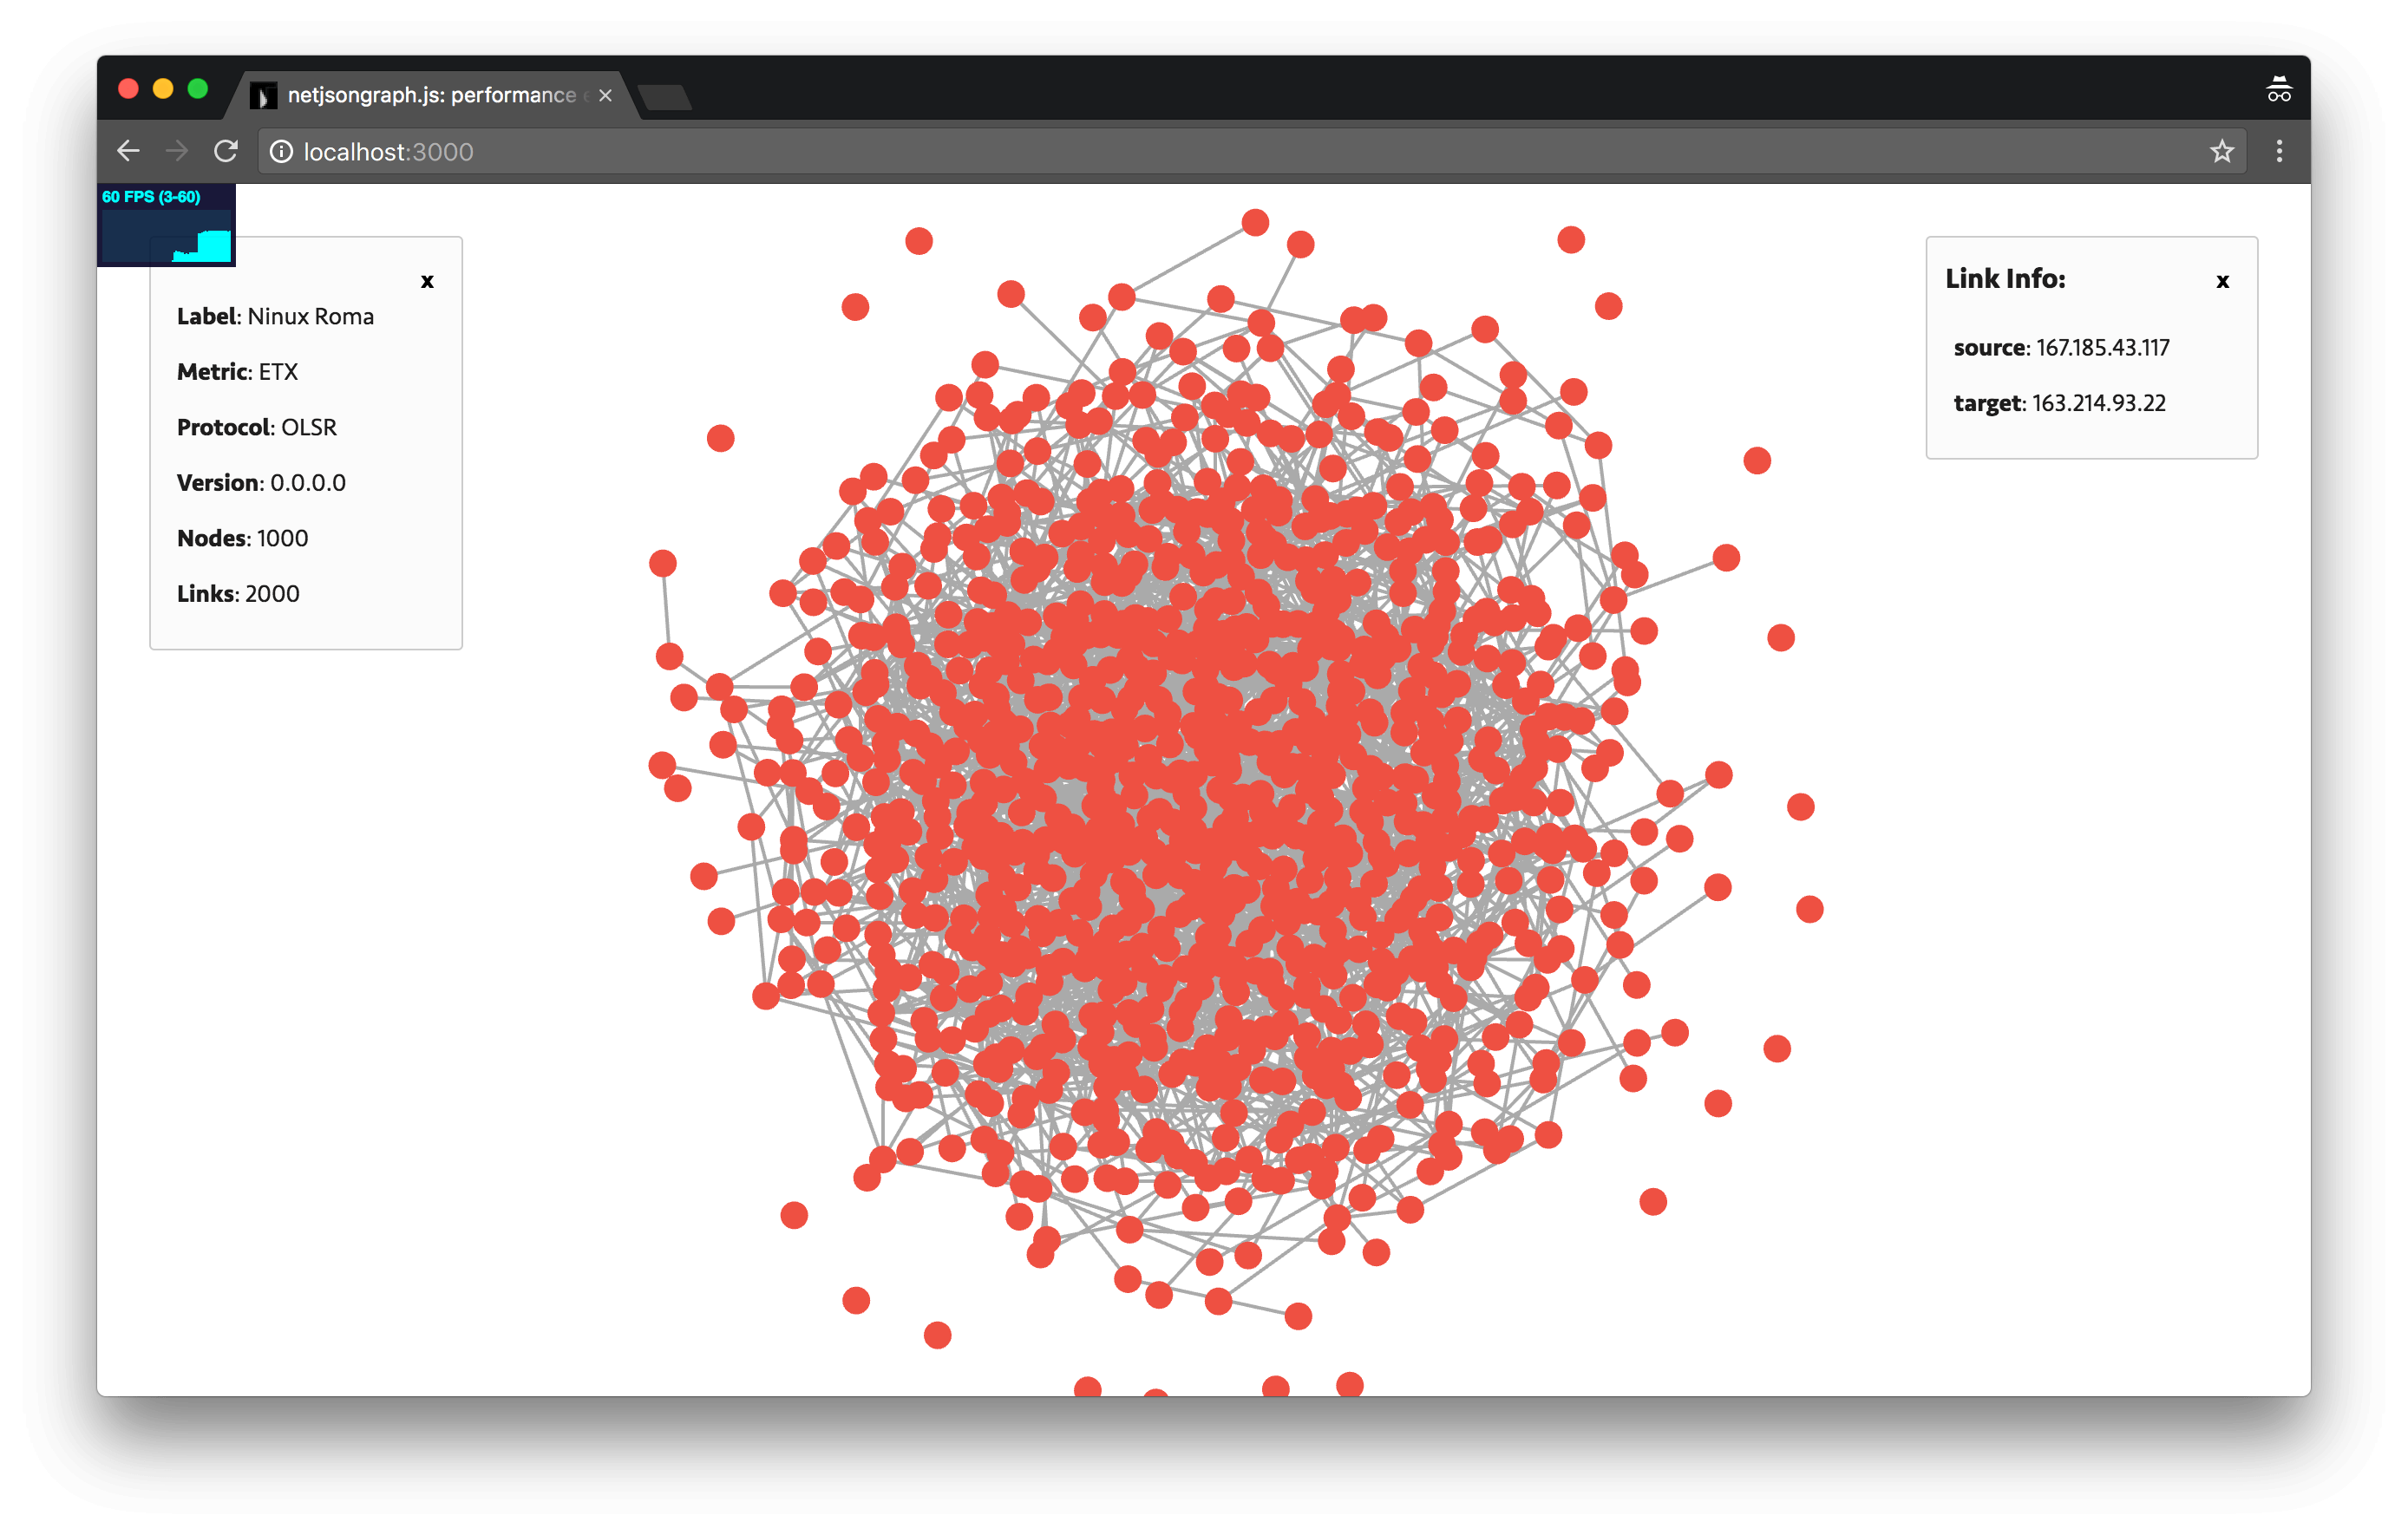
You can browse all examples on GitHub pages. Some screen shots of the application:
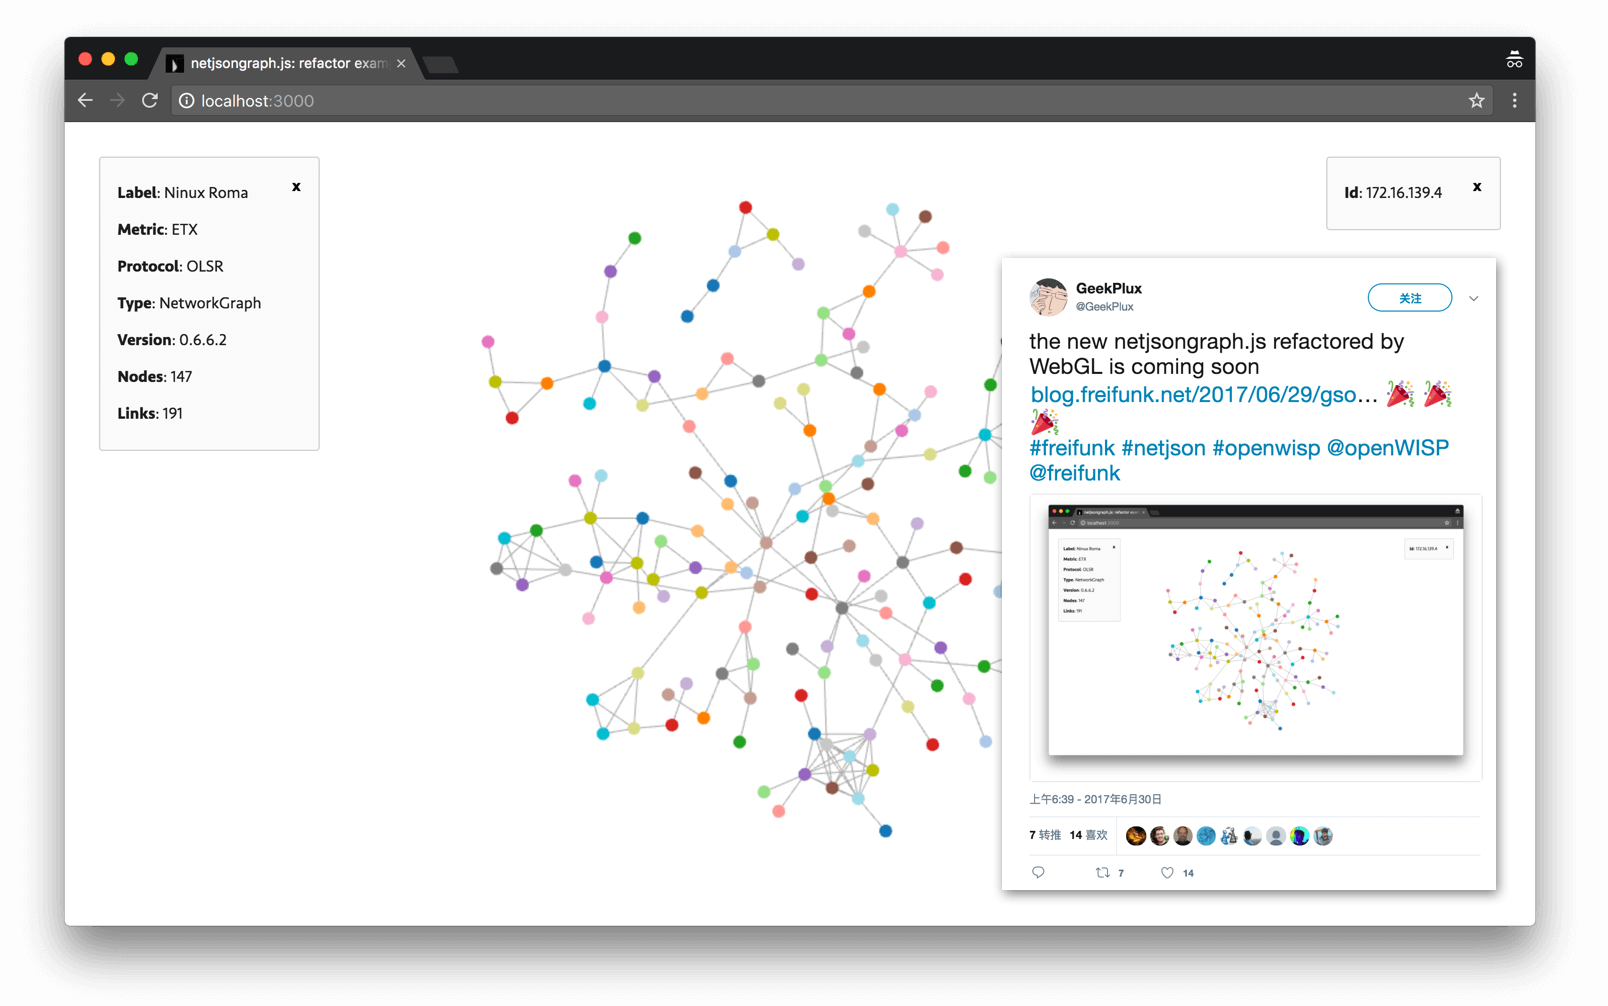
basic example

performance example

The force-directed layout is usually used to visualize network data. It offers insights on the relationships between nodes and links. The previous version of netjsongraph.js is implemented by d3 and it's rendered using SVG. It would be very slow if there were thousands or ten of thousands nodes or links. So I have to embrace the WebGL speeded up by GPU to have a better performance.

I have recorded my work in the blog every milestone:

BTW, It's a great management method to make members submit weekly reports and blog posts in Freifunk.

During the three months, there have been 116 commits from me. I created a big Pull Request include them:
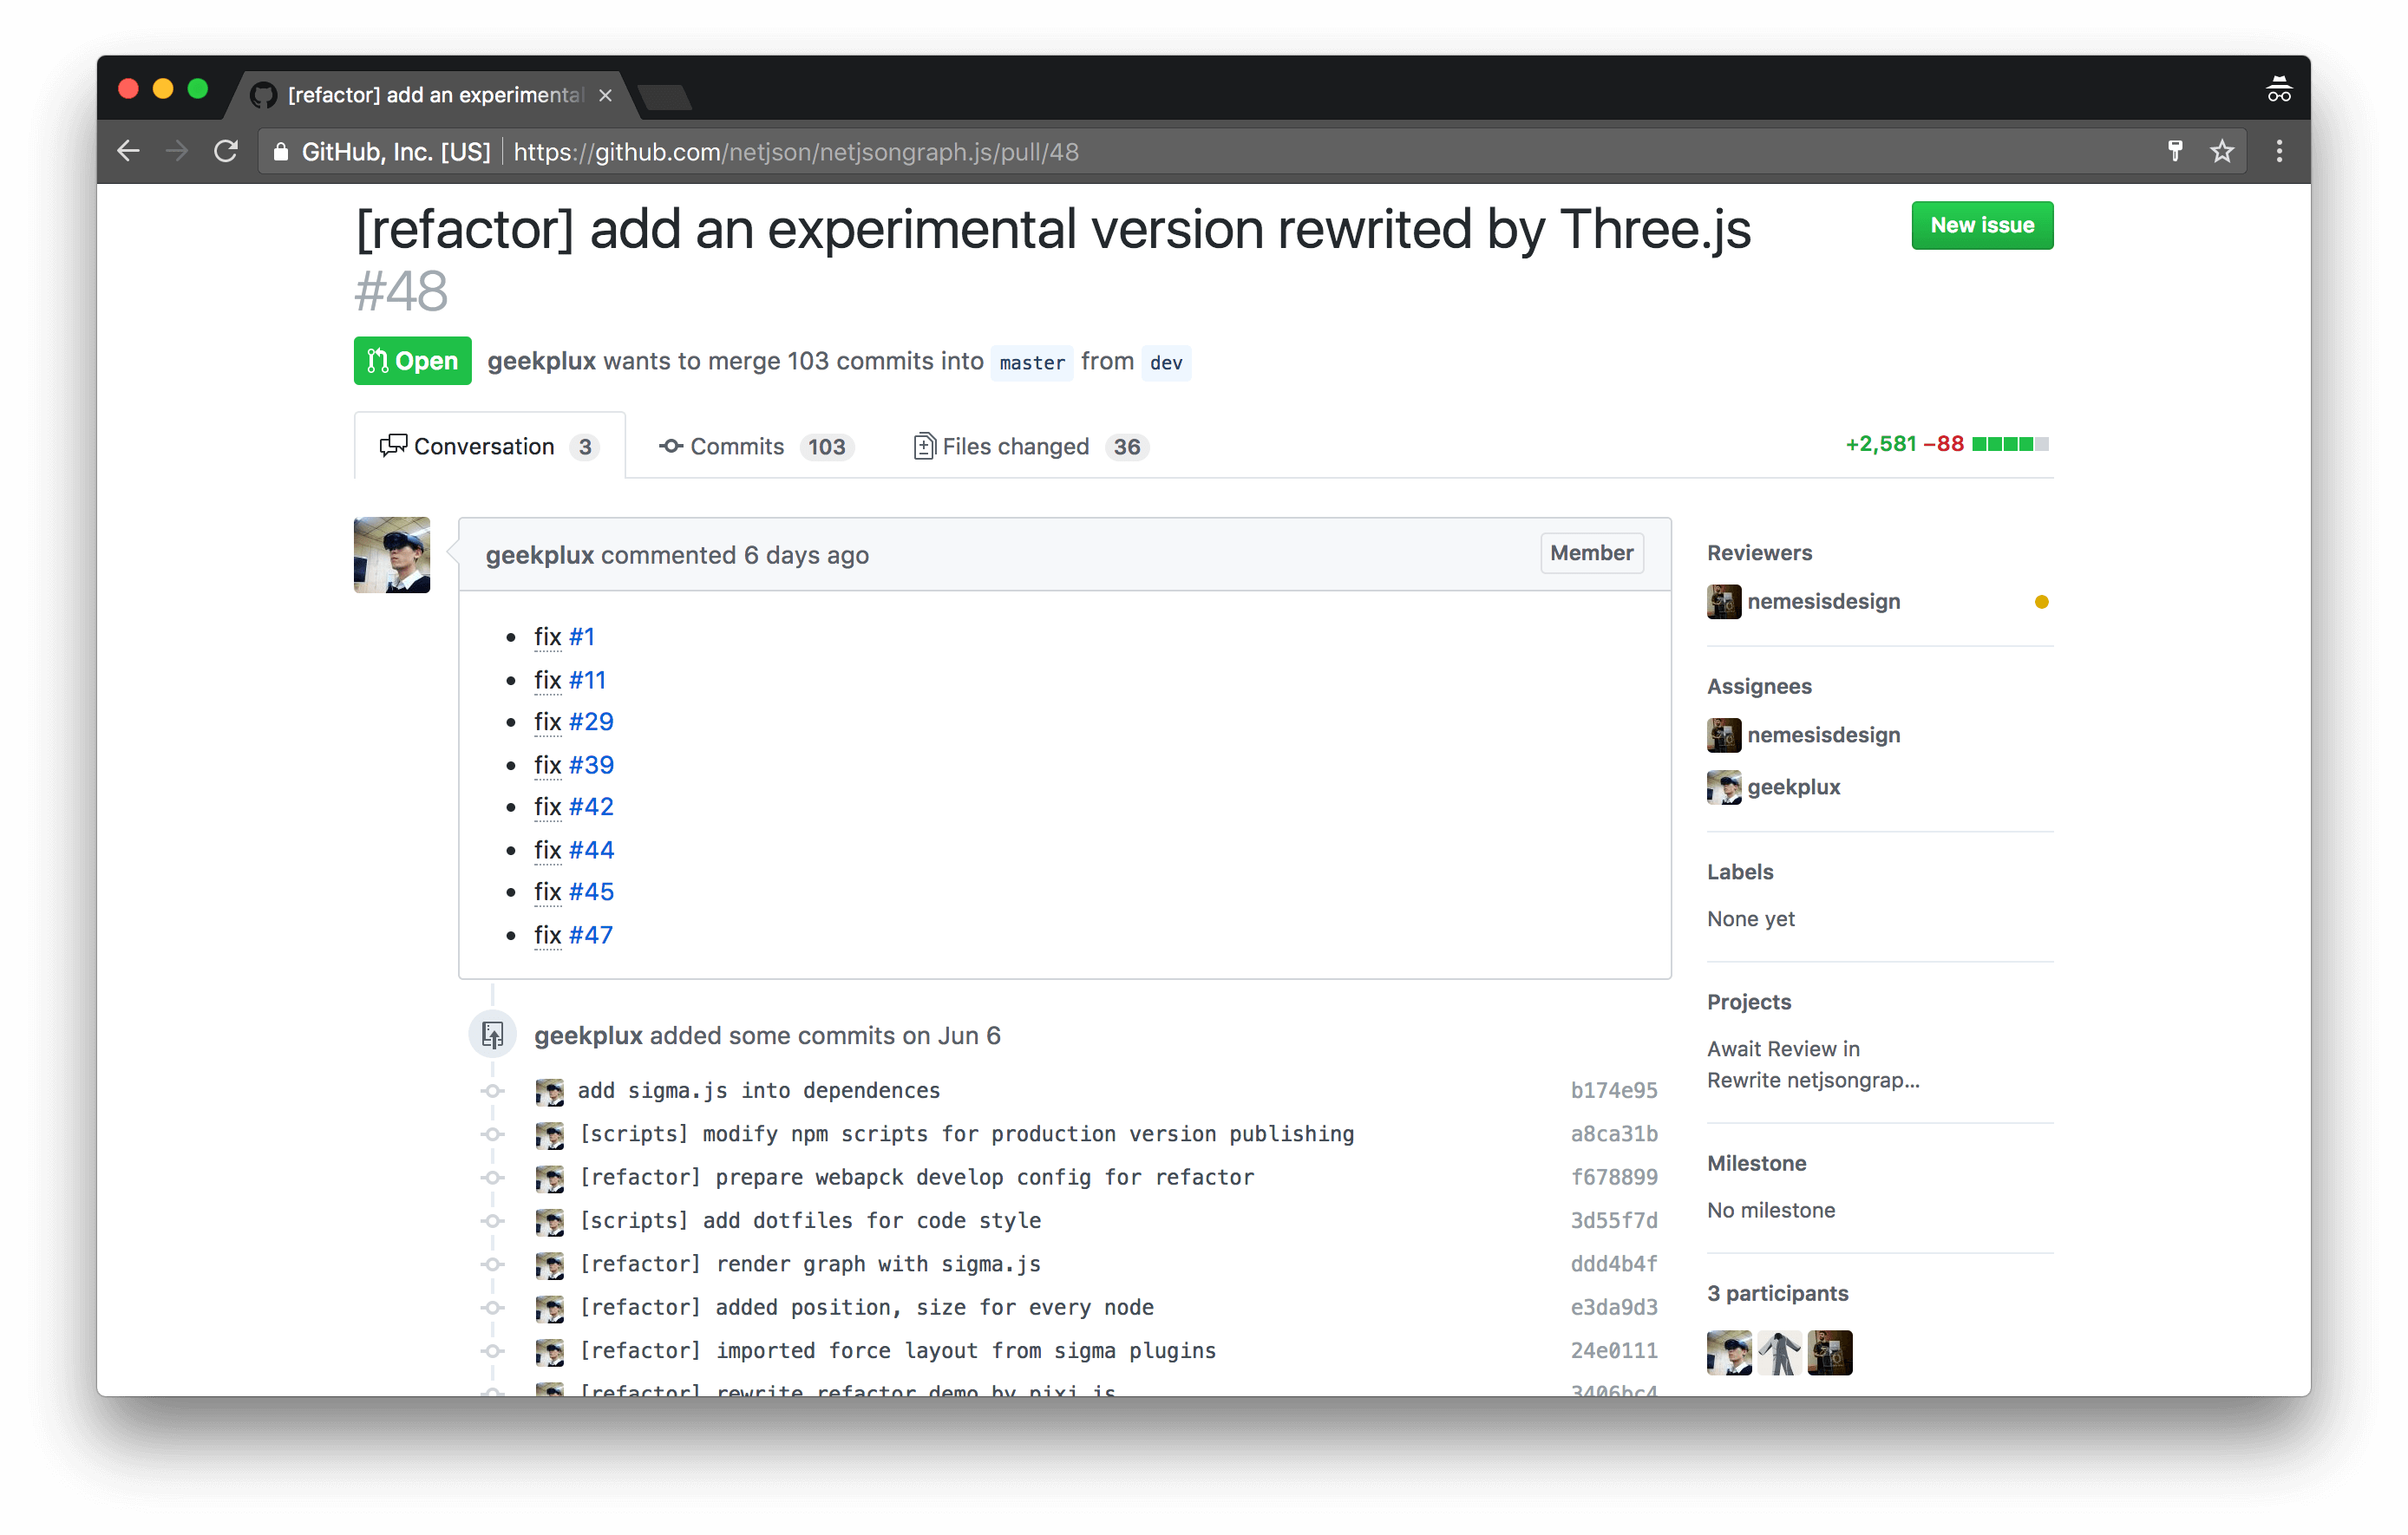
netjsongraph.js #48

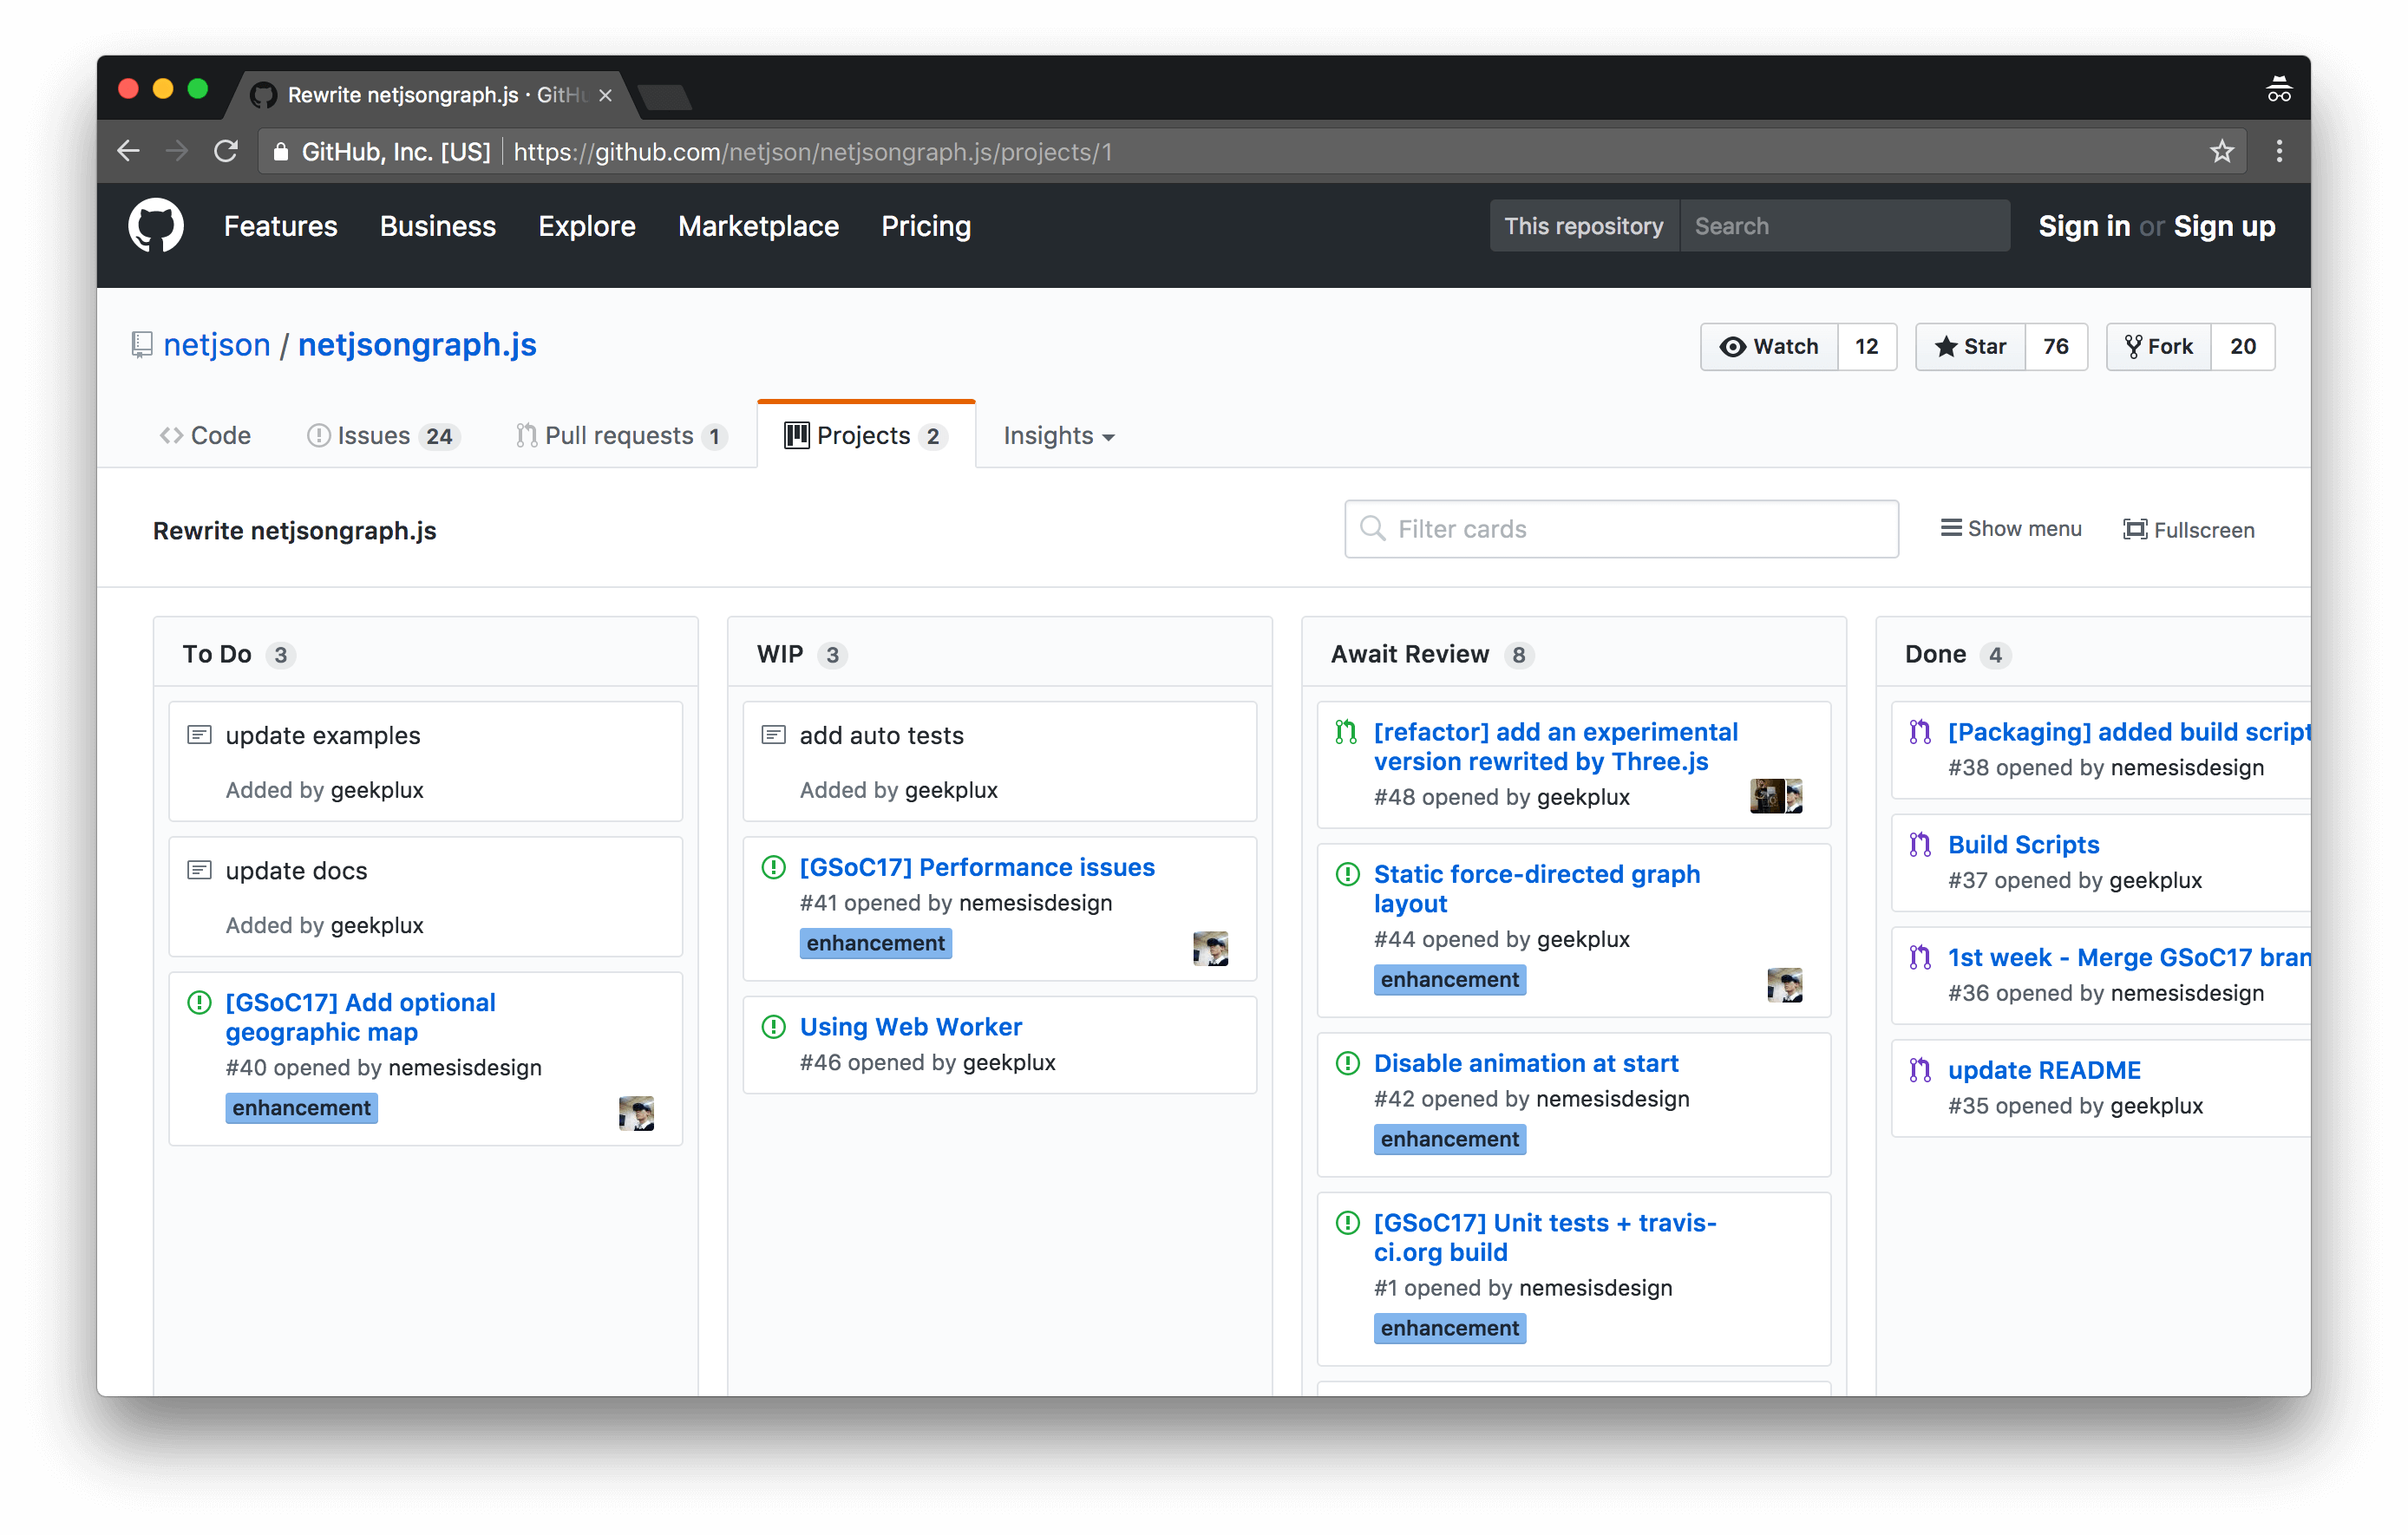
netjsongraph.js project panels

Almost all goals have achieved:

  • Published a minor version
  • Improved development workflow
  • Tests Added
  • Refactored visualization by Three.js and d3-force
  • Added more interaction like hover (show nodes tooltips), click (show nodes or links information panel), pan and zoom
  • Improved performance

Especially on performance aspect, it runs efficiently on Chrome reached 60FPS under 5k nodes and 10k links. And if you don't wanna animation, you can choose the static rendering layout.

Challenges

I also encounter some challenges I never met before.

Event binding and handling

As you know, WebGL renders all objects in one canvas tag. How to bind events on every geometry? You should use the Ray casting. Raycasting is used for mouse picking (working out what objects in the 3d space the mouse is over) amongst other things. So you can know which geometry your mouse over and add some interaction effect.

There are thousands of objects and every object has several events you should handle, I had to develop an event controller to manage it.

Performance

The bottleneck in this visualizer is performance(#41). I tried many methods to improve it include:

Reuse geometry and material

However, the color of every node is different and the one link should highlight itself when it hovered, so the material should be independent and can not use in common.

Combine the mesh

Same problem with above. It's not flexible to combine them to one mesh, different nodes and links should have different positions.

Static rendering

Make calculation before rendering, so there is no animation and repaint.

Using Web Worker

Web Workers is a simple means for web content to run scripts in background threads. The worker thread can perform tasks without interfering with the user interface. So put static layout calculation into it will be efficient.

Force-directed algorithm

There are different complexity and cost in the different force-directed algorithm. The Force-Atlas2 algorithm has some benefits over the force layout implemented in d3-force. So current version may be refactored by an advanced algorithm in the future.

What is left to be done

  • Add optional geographic map (#40)
  • Using Force-Atlas2 algorithm

More interactions and features should be added, and performance may be optimized by using new algorithm. I'd like to continue developing this project after GSoC.

In the end, thanks for the great patience and guidance from my mentors. Thanks for Google to provide me with this rare chance to contribute to an open source community together with awesome members from all over the world. I really appreciate this invaluable experience accumulated this summer and I believe it will have the profound impact on my career and life.