



惯性聚合 高效追踪和阅读你感兴趣的博客、新闻、科技资讯
阅读原文 在惯性聚合中打开

推荐订阅源

V
V2EX
爱范儿
爱范儿
Martin Fowler
Martin Fowler
T
The Blog of Author Tim Ferriss
B
Blog RSS Feed
博客园 - 聂微东
G
GRAHAM CLULEY
Engineering at Meta
Engineering at Meta
Threat Intelligence Blog | Flashpoint
WordPress大学
WordPress大学
Scott Helme
Scott Helme
AI
AI
S
Security Affairs
T
Threat Research - Cisco Blogs
M
MIT News - Artificial intelligence
T
Troy Hunt's Blog
H
Hackread – Cybersecurity News, Data Breaches, AI and More
人人都是产品经理
人人都是产品经理
AWS News Blog
AWS News Blog
T
Threatpost
Cyberwarzone
Cyberwarzone
www.infosecurity-magazine.com
U
Unit 42
V
Vulnerabilities – Threatpost
J
Java Code Geeks
博客园 - Franky
月光博客
月光博客
Blog — PlanetScale
Blog — PlanetScale
NISL@THU
NISL@THU
D
Docker
小众软件
小众软件
N
News and Events Feed by Topic
Microsoft Security Blog
Y
Y Combinator Blog
A
Arctic Wolf
D
DataBreaches.Net
云风的 BLOG
云风的 BLOG
Forbes - Security
Forbes - Security
量子位
PCI Perspectives
PCI Perspectives
美团技术团队
K
KPMG report finds enterprise disconnect between AI and its ROI | CIO
I
InfoQ
Security Archives - TechRepublic
有赞技术团队
有赞技术团队
腾讯CDC
P
Proofpoint News Feed
S
Security @ Cisco Blogs
G
Google Developers Blog
C
Cisco Blogs

博客园 - kingkoo

ReaHat7.6/7.7 最小化安装更新yum源 java程序员经常使用的Intellij Idea插件 NDK版本 下载地址 DMSFrame 之查询表达式用法(一) Wise 打包细节 将Centos的yum源更换为国内的阿里云(163)源 Centos下安装 .net Core运行程序 使用 Docker 一步搞定 ZooKeeper 集群的搭建 docker 安装与学习 maven中scope标签以及exclusions 记录 Centos MySQL数据库迁移详细步骤 Maven 本地仓库明明有jar包,pom文件还是报错解决办法 位与,位或,位异或运算符的理解 编程中位运算用法总结 C++ CompletionPort(完成端口)示例 消息中间件Notify和MetaQ-阿里中间件 DMSFrame 之SqlCacheDependency(二) DMSFrame 之SqlCacheDependency(一) DMSFrame 之简单用法(二)
在Intellij IDEA下用X-debug调试PHP
kingkoo · 2018-04-24 · via 博客园 - kingkoo

用Intellij IDEA使用X-debug来调试PHP,主要需要配置的部分有三个地方,分别为php.ini的配置,IDEA的配置和浏览器的配置,主要如下:

php.ini(wamp修改的是phpForApache.ini)的主要配置如下所示,关键参数根据实际情况可以修改:

xdebug 下载地址: https://xdebug.org/download.php

zend_extension  = "d:/wamp/bin/php/php7.1.16/zend_ext/php_xdebug-2.6.0-7.1-vc14-x86_64.dll"
xdebug.profiler_enable = 0
xdebug.profiler_enable_trigger = 0
xdebug.profiler_output_name = cachegrind.out.%t.%p
xdebug.profiler_output_dir ="D:/wamp/tmp"
xdebug.auto_trace = 0
xdebug.show_local_vars=0
xdebug.var_display_max_children=128 
xdebug.var_display_max_data=512 
xdebug.var_display_max_depth=5
xdebug.idekey=xdebug-info
xdebug.remote_enable = On
;IDE所在机器IP
xdebug.remote_host=127.0.0.1 
;IDE监听的端口号,用来和服务端的XDEBUG通信用
xdebug.remote_port=9000 
xdebug.remote_handler=dbgp
; //这个要加上,否则无法调试,这个配置的作用是当配置的远程IDE的host和端口号有问题时,会通过请求头读取IDE的IP从而完成通信
xdebug.remote_connect_back=1
xdebug.remote_autostart=0

配置好了,在CMD里面输入

如果能看到XDebug模块,说明开启成功。

*: 值得注意的是,这里需要确定好XDebug和PHP的对应版本

IDEA的配置如下:
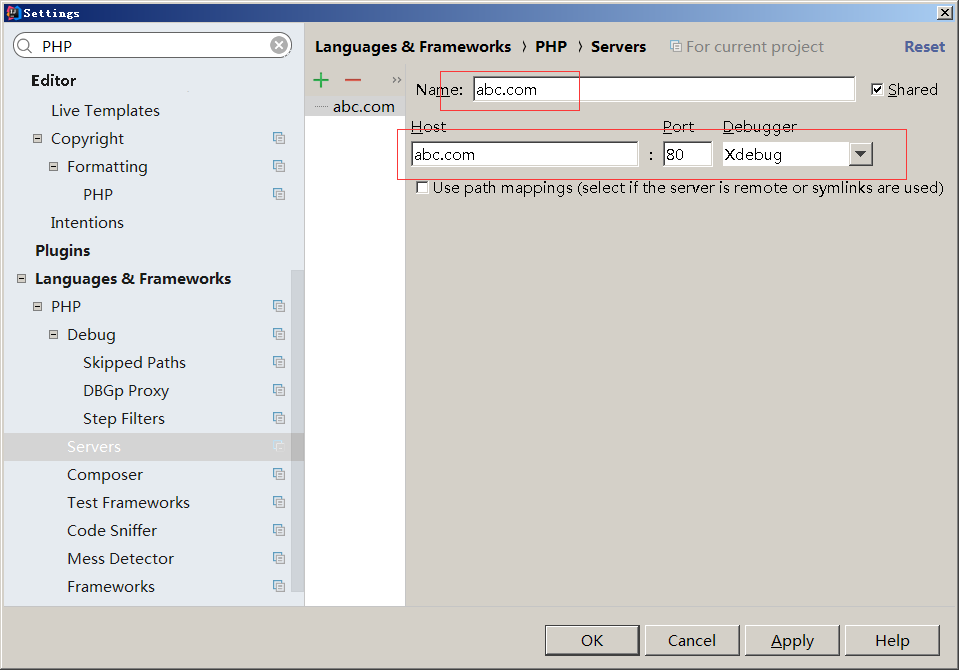
进入File>Settings>PHP>Servers,这里要填写服务器端的相关信息,name填要调试的主机名 (如:abc.com或者localhost等),host填(如:localhost或者abc.com等),port填 80,debugger选XDebug
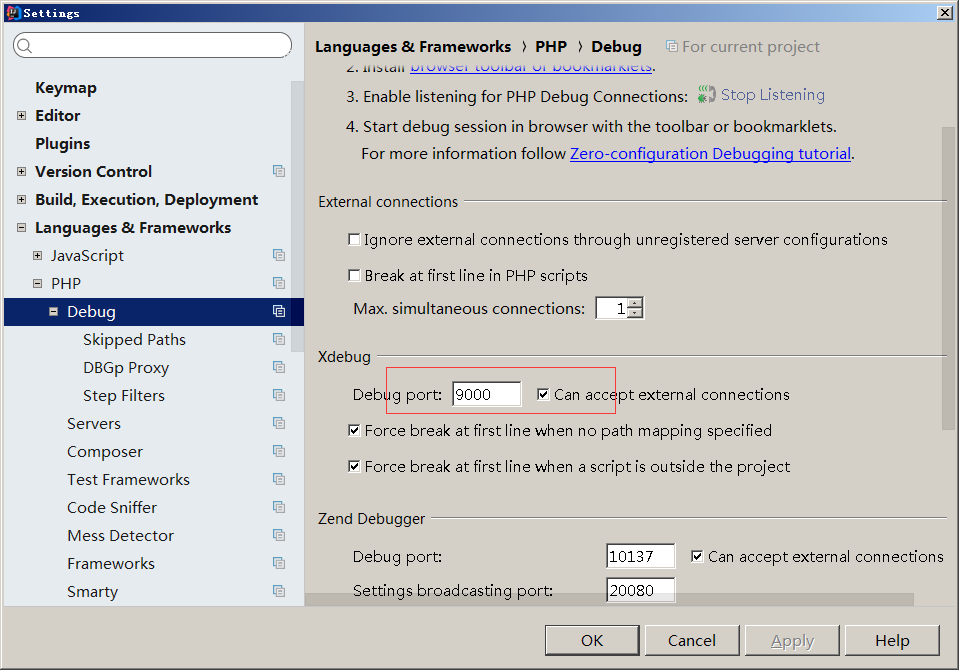
进入File>Settings>PHP>Debug,看到XDebug选项卡,port填9000,其他默认
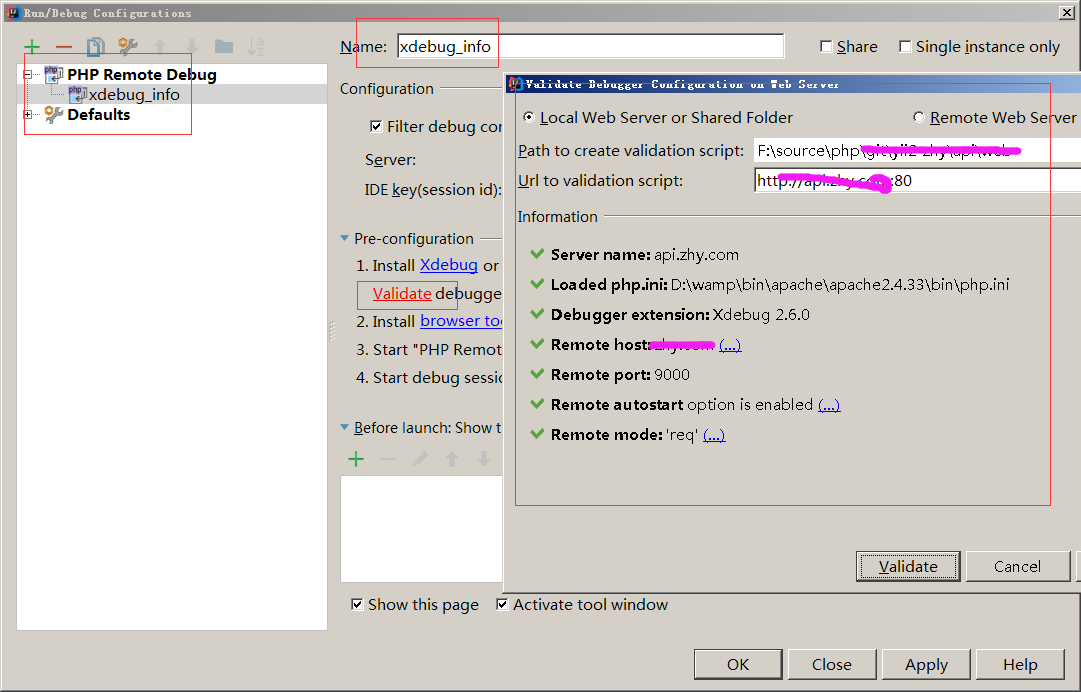
进入File>Settings>PHP>Debug>DBGp Proxy,IDE key 填 xdebug_info,host 填abc.com,port 填80

和php.ini的IDE_key要保持一致哦。。。。。、

最好有空可以建一个remote_debug检查一下
最后就是浏览器设置了我下载的是xdebug Helper