惯性聚合 高效追踪和阅读你感兴趣的博客、新闻、科技资讯
阅读原文 在惯性聚合中打开

推荐订阅源

T
Threat Research - Cisco Blogs
freeCodeCamp Programming Tutorials: Python, JavaScript, Git & More
cs.AI updates on arXiv.org
V
Vulnerabilities – Threatpost
GbyAI
GbyAI
P
Proofpoint News Feed
L
LINUX DO - 热门话题
P
Palo Alto Networks Blog
A
About on SuperTechFans
T
Tenable Blog
M
MIT News - Artificial intelligence
IT之家
IT之家
I
Intezer
D
DataBreaches.Net
爱范儿
爱范儿
T
Threatpost
C
CERT Recently Published Vulnerability Notes
云风的 BLOG
云风的 BLOG
博客园 - 三生石上(FineUI控件)
WordPress大学
WordPress大学
K
Kaspersky official blog
大猫的无限游戏
大猫的无限游戏
A
Arctic Wolf
Y
Y Combinator Blog
Cyberwarzone
Cyberwarzone
酷 壳 – CoolShell
酷 壳 – CoolShell
D
Darknet – Hacking Tools, Hacker News & Cyber Security
H
Help Net Security
Microsoft Security Blog
Spread Privacy
Spread Privacy
奇客Solidot–传递最新科技情报
奇客Solidot–传递最新科技情报
AWS News Blog
AWS News Blog
博客园 - 聂微东
C
Check Point Blog
S
Securelist
有赞技术团队
有赞技术团队
雷峰网
雷峰网
aimingoo的专栏
aimingoo的专栏
Last Week in AI
Last Week in AI
Stack Overflow Blog
Stack Overflow Blog
MongoDB | Blog
MongoDB | Blog
D
Docker
G
GRAHAM CLULEY
T
The Exploit Database - CXSecurity.com
C
Cybersecurity and Infrastructure Security Agency CISA
T
Tailwind CSS Blog
L
Lohrmann on Cybersecurity
G
Google Developers Blog
C
Cyber Attacks, Cyber Crime and Cyber Security
L
LangChain Blog

博客园 - YISONG

国内大学ip地址范围 MODIS产品列表 美国研发高精度气候模型精确预测气候状况 ArcMap的地图代数运算 第二轮气候谈判无突破性进展 博文阅读密码验证 - 博客园 NDVI result seems wrong 人工智能的瓶颈问题与本体论语义学的回应(赵泽林,高新民) 国外生态学和环境科学期刊简介 晚上洗头,有害无益 全球气候:变冷还是变暖? 西方哲学史的主要发展阶段 Eclipse插件安装的三种方法 Matlab帖子收藏 textread读取记事本文件 matlab 通用神经网络代码 试图运行项目时出错:无法启动调试,进程已经终止 - YISONG 博弈论与最优化的关系 搞学术的必用,几种功能强大的搜索利器
Raster dataset statistics
YISONG · 2010-06-14 · via 博客园 - YISONG

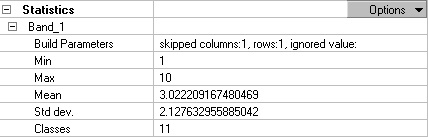
In Arcmap, The statistics for a raster dataset can be viewed on the Raster Dataset Properties dialog box. Below is an example showing the statistics for a thematic raster dataset such as a land-use dataset. Statistics are calculated for each band; if there is more than one band in the raster datasets, the statistics for each band are present. You can see that the parameters used to build the statistics are listed. The statistics that are calculated include the minimum and maximum pixel values as well as the mean and standard deviation of the calculated pixel values, and if the dataset is thematic, the number of classes is listed. If your dataset is continuous, there will be no classes.

Geoprocessing tool reference > Data Management toolbox > Raster toolset > Raster Properties toolset > Tools > Calculate Statistics

posted on 2010-06-14 16:42  YISONG  阅读(366)  评论()    收藏  举报