


Application slowness and downtime severely affect customer satisfaction, cause business interruptions, and can potentially impact revenue. When a critical app fails in complex, distributed environments, quickly identifying the root cause is the biggest challenge. During high-severity incidents, IT teams struggle in troubleshooting war rooms. Teams are constantly frustrated, with a fundamental question: does the issue lie with the underlying infrastructure, or the application itself?
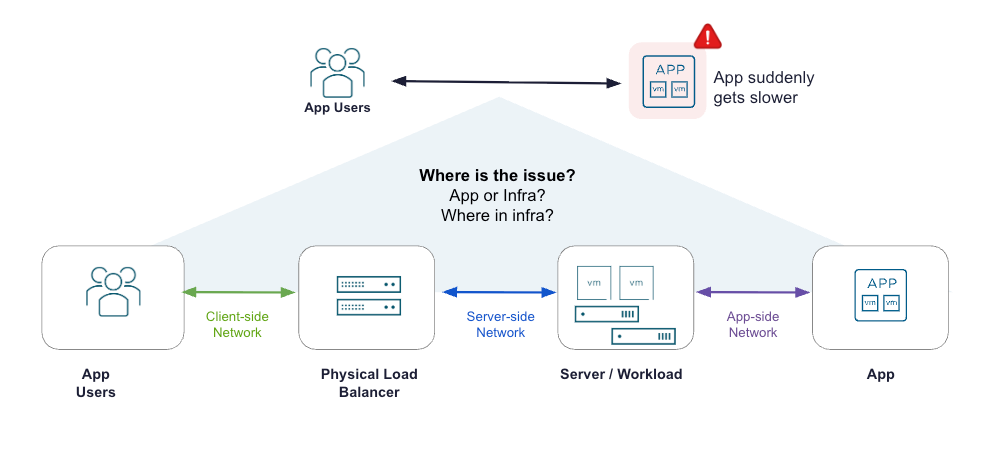
In the traditional approach, Network, Infrastructure, and DevOps teams are forced to operate in silos. They rely on different tools and disparate datasets without end-to-end visibility. What they end up with is an exhausting cycle of back-and-forth communication. Finding the root cause becomes a cumbersome, friction-heavy ordeal that takes days, if not weeks, to resolve. Legacy load balancers, despite receiving both client-side and service-side transactions, are only able to offer fragmented metrics.
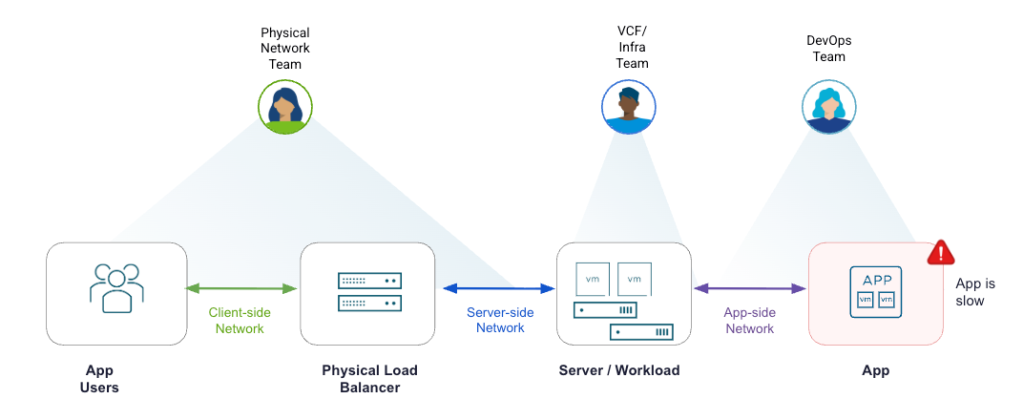
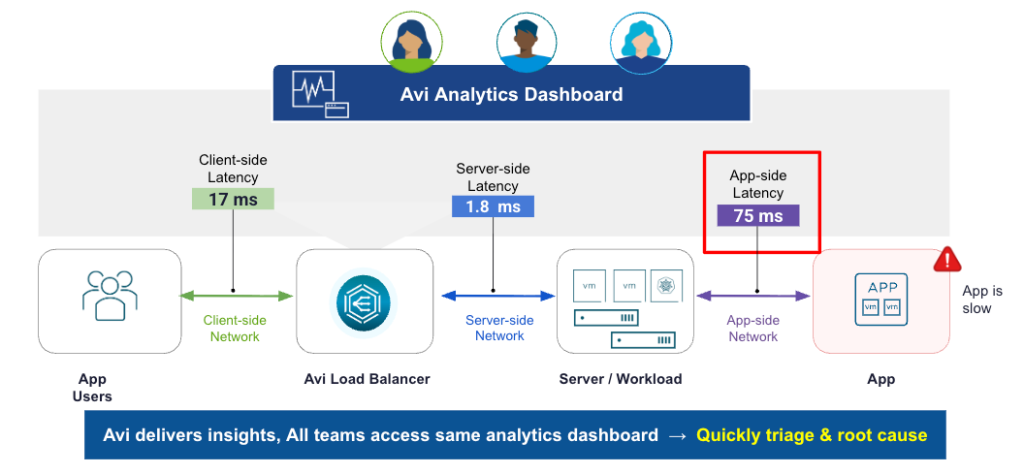
Avi’s software-defined load balancing architecture is the key to its uncontested analytics advantage. Avi captures complete, transaction-level telemetry across every flow in a unified dashboard, empowering siloed teams to gain access to the same end-to-end application latency analytics across client, server and application. All teams can instantly pinpoint the root cause of performance bottlenecks or security threats with precision. Let us take a closer look:
Reduced Mean Time to Innocence (MTTI) with Granular Analytics:
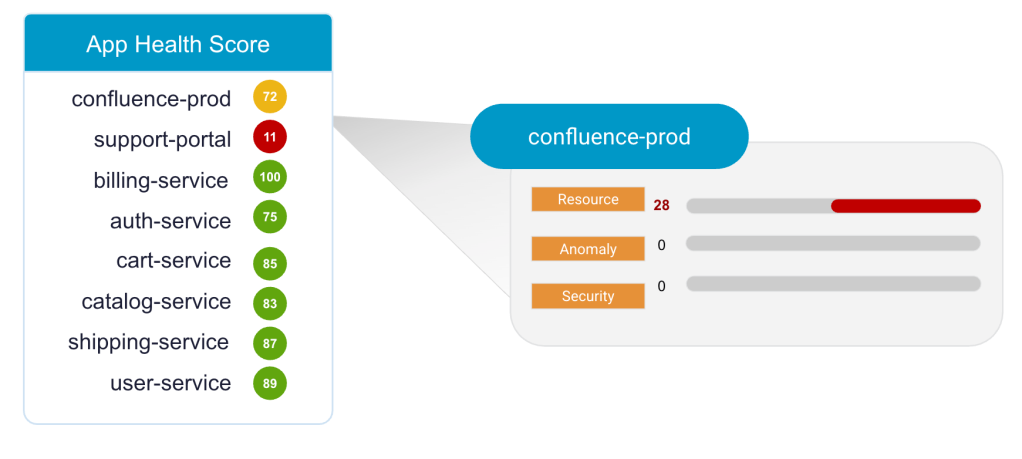
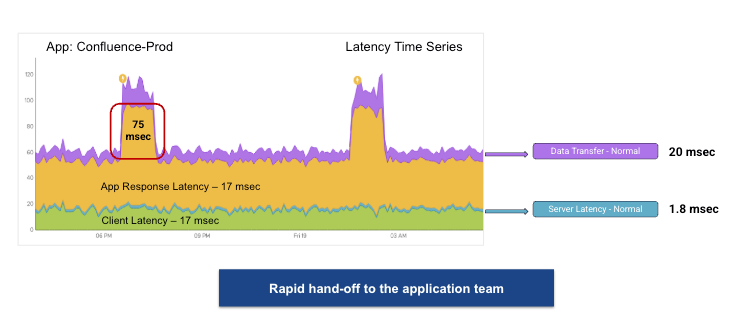
Avi Analytics synthesizes app performance data into easily interpretable health scores ranging from 0-100. Avi App Health Score provides a comprehensive measure of an application’s or virtual service’s overall health, combining performance, resource availability, anomalous behavior and security risk factors. These scores deliver actionable insights, allowing administrators to quickly pinpoint issues from the dashboard. For example, a yellow score of 72 for “confluence prod” immediately signals service degradation due to underlying resources, highlighting critical problems with relevant troubleshooting information.
Furthermore, Avi Analytics significantly reduces MTTI by providing granular visibility into every application transaction. By centralizing these metrics within a unified dashboard, cross-functional teams can immediately identify the 75ms latency comes from the application, not network or client. This data-driven approach reduces lengthy triaging, allowing organizations to pinpoint the exact origin of performance bottlenecks with surgical precision.
Improved Application Resiliency with Built-in Web App Security:
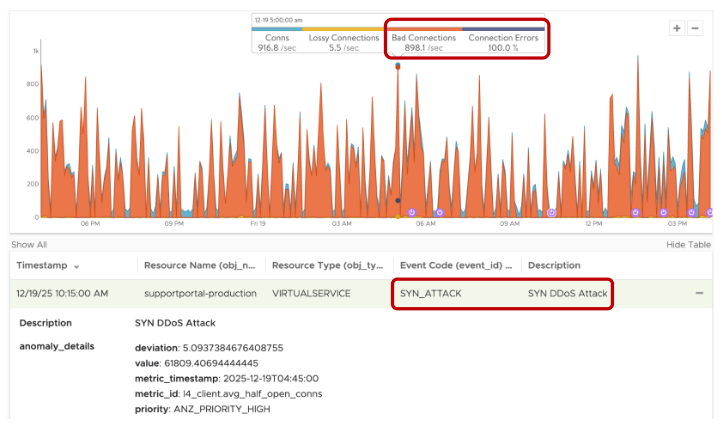
By integrating security insights directly into the App Health Score, Avi improves application protection with built-in web app firewall (WAF). The platform’s real-time analytics identify high-frequency connection errors and flag sophisticated web attacks such as DDoS attacks – detection to automated mitigation in minutes. The result is a more app resiliency that maintains high availability and performance, even under heavy load or targeted web-based threats.
Minimum Application Downtime with Transient Issues Identification:
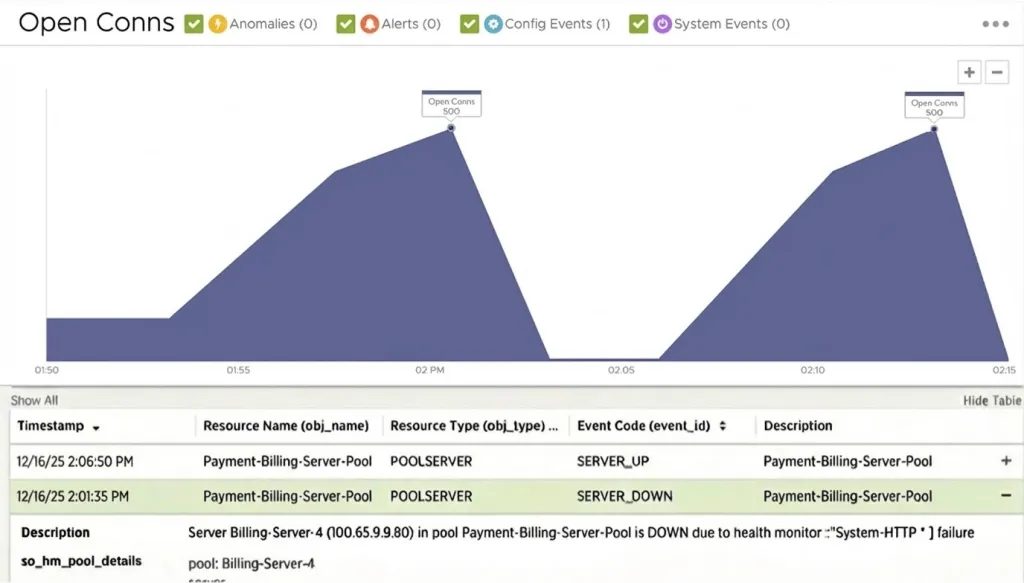
Avi accelerates root-cause analysis by leveraging deep historical analytics, effectively removing the need for teams to wait for intermittent issues to recur. While traditional hardware load balancers are almost impossible to identify transient “needle in the haystack” anomalies, Avi’s detailed transaction logs enable engineers to drill down into specific pool server IP addresses and identify VM resource exhaustion – which is an underlying application issue.
Legacy load balancers fail to meet the performance, agility, and scalability needs of modern applications. Troubleshooting application performance issues has turned into a reactive, tedious process. Avi collects in-traffic analytics and provides a unified “single source of truth” that reduces the operational “lengthy triaging” across network, security, and application teams
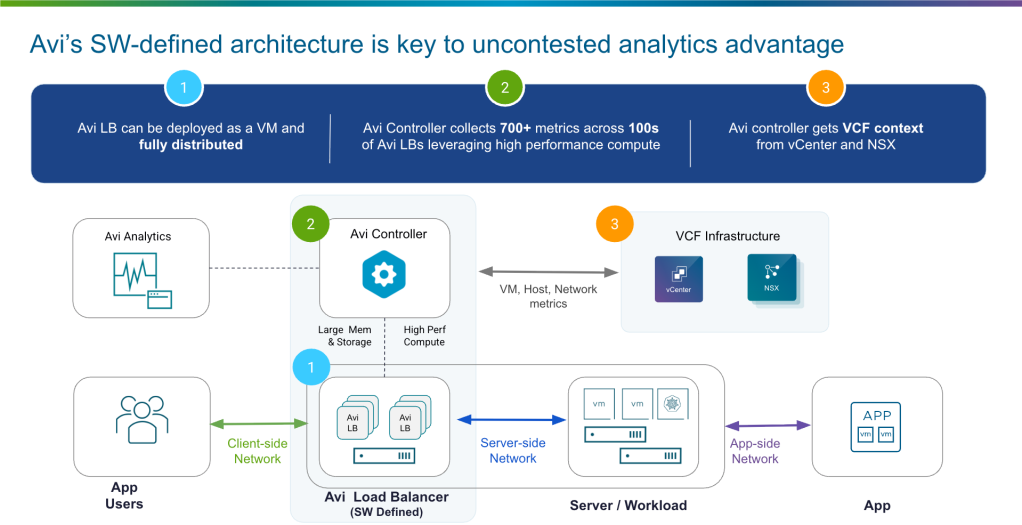
Software-Defined Architecture: Avi achieves real-time, in-depth visibility by decoupling the centralized control plane from the distributed data plane. Avi is deployed as virtual machines alongside compute infrastructure. Avi captures granular telemetry from the traffic flow, offering comprehensive analytics and end-to-end visibility from a single console to accelerate troubleshooting, automate scaling, and proactively ensure high application performance.
Comprehensive Data and Scope: Avi Controller continuously aggregates over 700 performance metrics from distributed load balancers. Leveraging high-performance compute, Avi processes a massive telemetry data lake, applying advanced ML/AI inferences to analyze patterns and anomalies. Avi Analytics transforms infrastructure data into actionable application insights, enabling IT teams to move beyond reactive troubleshooting to proactive optimization.
Plug-and-Play VCF Context: Avi uniquely integrates deeply and natively with the VCF private cloud. With VCF workload context, Avi provides consistent visibility across VMs and containers. This contextual awareness aligns application delivery and security with the infrastructure, reducing blind spots and streamlining load balancing on VCF.
The network teams at a very large financial organization were constantly over burdened with a huge backlog of application troubleshooting tickets before implementing Avi Analytics. The limited visibility provided by their legacy load balancers meant that all application issues were directed to the network teams, even those not caused by the network. This created a significant bottleneck, with operations handling almost all tickets.
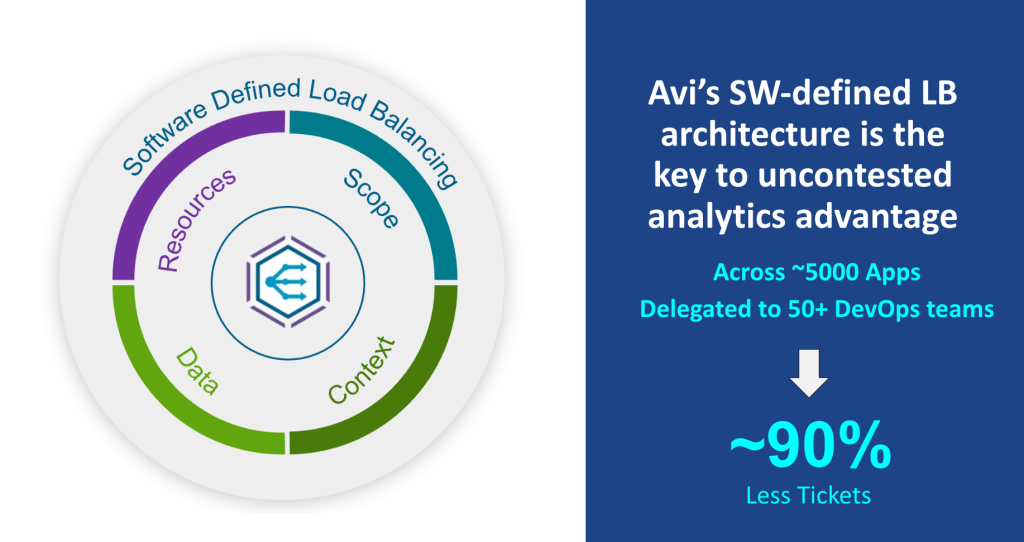
With the deployment of Avi Analytics, the organization empowered over 50 DevOps teams with direct access to a unified analytics dashboard. This gave teams actionable insights across more than 90,000 virtual IPs, allowing them to independently diagnose whether an issue was rooted in the application or the network.
The shift to modern, analytics-driven load balancing resulted in a dramatic 90% reduction in application-related tickets reaching the network team. Consequently, operations staff were able to re-deploy their resources from ticket handling to focus on higher-value, strategic projects, highlighting the clear advantage of this approach over traditional load balancing.
Here is a comprehensive demo of the Avi Analytics dashboard in action.
此内容由惯性聚合(RSS阅读器)自动聚合整理,仅供阅读参考。 原文来自 — 版权归原作者所有。