惯性聚合 高效追踪和阅读你感兴趣的博客、新闻、科技资讯
阅读原文 在惯性聚合中打开

推荐订阅源

Google DeepMind News
Stack Overflow Blog
Stack Overflow Blog
Hugging Face - Blog
Hugging Face - Blog
博客园_首页
T
The Blog of Author Tim Ferriss
博客园 - 叶小钗
N
Netflix TechBlog - Medium
腾讯CDC
C
Check Point Blog
P
Proofpoint News Feed
Engineering at Meta
Engineering at Meta
GbyAI
GbyAI
S
SegmentFault 最新的问题
F
Fortinet All Blogs
美团技术团队
U
Unit 42
freeCodeCamp Programming Tutorials: Python, JavaScript, Git & More
博客园 - 司徒正美
F
Full Disclosure
Recorded Future
Recorded Future
D
DataBreaches.Net
博客园 - 【当耐特】
Martin Fowler
Martin Fowler
J
Java Code Geeks
I
InfoQ
Y
Y Combinator Blog
A
About on SuperTechFans
AI
AI
爱范儿
爱范儿
Exploit-DB.com RSS Feed
Forbes - Security
Forbes - Security
W
WeLiveSecurity
M
MIT News - Artificial intelligence
雷峰网
雷峰网
cs.CV updates on arXiv.org
Simon Willison's Weblog
Schneier on Security
The GitHub Blog
The GitHub Blog
Security Archives - TechRepublic
aimingoo的专栏
aimingoo的专栏
Cyber Security Advisories - MS-ISAC
G
GRAHAM CLULEY
Know Your Adversary
Know Your Adversary
Latest news
Latest news
Threat Intelligence Blog | Flashpoint
D
Docker
Recent Commits to openclaw:main
量子位
V2EX - 技术
V2EX - 技术
Project Zero
Project Zero

博客园 - 风雨行者

使用 Qjx.CustomCache 在接口进行AOP 数据缓存 asp.net core 基于autofac 实现AOP 拦截 之 第三种方式 -基于class asp.net core 基于autofac 实现AOP 拦截 之 第二种方式 -基于class asp.net core 3.1 应用Aufac 进行AOP 的三种方式1 基于接口AOP linux之 tomcat 安装配置入门 linux的nginx的安装以及负载均衡 linux 系统管理 linux 服务管理 redis主从复制 读写分离 Redis 集群部署之Redis 安装(1) hbuilder 运行在 android 模拟器中 asp.net digest 摘要认证过程 转载:Spring Boot 不使用默认的 parent,改用自己的项目的 paren 转载学习:windows下将ES和kibana作为服务启动 转(以作记录):cmd命令行---进行Windows服务操作 在 .NET Core 中使用 Diagnostics MyEclipse 使用外部tomcat 调试springboot Git与GitHub 学习笔记 dropdownlist 支持键盘拼音定位选择
.NET Core CLI 的性能诊断介绍
风雨行者 · 2020-07-14 · via 博客园 - 风雨行者

在网上闲逛,看到了一篇关于.net性能诊断的文章,特此记录

MSDN网址:

https://docs.microsoft.com/zh-cn/dotnet/core/diagnostics/debug-memory-leak

我使用的windows环境,写一下步骤

(1)打开windows powershell 执行以下命令安装工具

dotnet tool install --global dotnet-trace

dotnet tool install --global dotnet-counters

dotnet tool install --global dotnet-dump

(2)下载demo

https://docs.microsoft.com/zh-cn/samples/dotnet/samples/diagnostic-scenarios/

(3)运行demo(可以直接dotnet run),

如有问题可以用vs打开进行一些修改,修改一下目标框架,然后再运行

(4)运行dotnet-trace ps 

查看哪个进程是.net core 进程

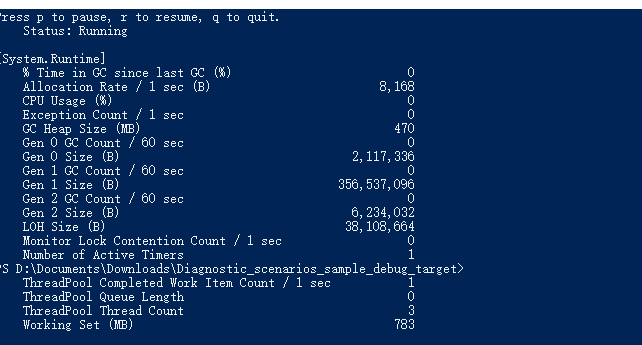
(5)打开一个新的power shell ,执行一下命令

dotnet-counters monitor --refresh-interval 1 -p 【pid】

打开监控计数器,能看到对象数量

 (6)打开新的powershell 运行以下命令

dotnet-dump collect -p 【pid】

收集内存数据到文件

(7)分析数据

dotnet-dump analyze 【filename】

dumpheap -stat  ---查看对象数量

具体请看MSDN