





Many teams encounter the same frustration when scaling large language model workloads: they purchase faster GPUs, deploy a larger inference cluster, and still fall short of their latency or throughput goals. The reason is simple: LLM inference isn’t bound by a single component. Performance is determined by the entire serving stack, from tokenization and prompt preprocessing all the way to KV-cache management, GPU scheduling, and token streaming. In reality, slow inference is frequently a system’s problem.
Modern serving stacks, such as vLLM, Hugging Face Text Generation Inference, and TensorRT-LLM, are designed with this in mind. They emphasize capabilities like continuous/in-flight batching, improved KV-cache utilization, paged attention, chunked prefill, and scheduling strategies that maximize accelerator utilization without compromising user-visible latency. This focus is important because LLM inference actually has two distinct performance regimes: prefill, which is typically compute-intensive, and decode, which is often memory bandwidth and KV-cache movement bound, rather than throughput.
This post discusses some of the often-overlooked bottlenecks that can limit LLM inference speed in production and provides guidance on how to address them.
Let’s look at what actually happens during an LLM inference request. From the outside, each request is conceptually straightforward. A user submits text and receives tokens back in return. Internally, the serving pipeline is more complex:
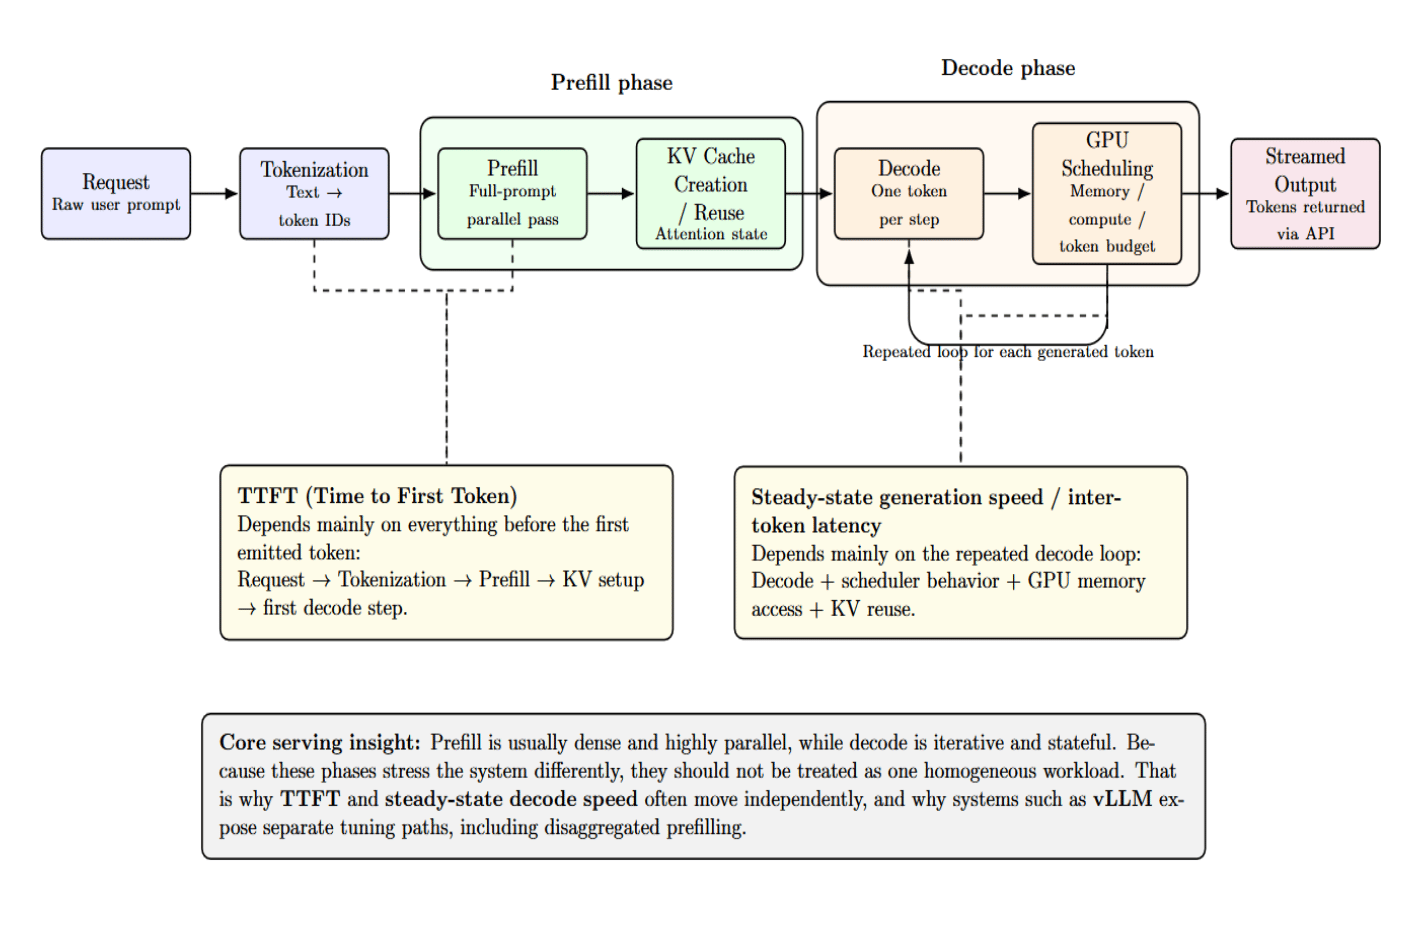
The request must first be tokenized, meaning that the raw text is converted into IDs that correspond with tokens. Prefill then performs batch processing on the entire prompt at once, in parallel, and initializes the KV cache. Decode then runs iteratively, producing one token at a time and reusing that KV state forward. The system scheduler then determines how these operations share access to GPUs, memory, and token budgets.
Once decoded, tokens are streamed out to users via the API layer. Prefill and decode timing can (and frequently do) diverge because of this. This is why TTFT and steady-state generation speed often move independently: the former depends heavily on everything before the first emitted token, while the latter speed depends on the repeated decode loop.
This split between prefill and decode is one of the fundamental ideas behind LLM serving. Prefill can usually be made dense and highly parallel. Decode is inherently iterative and stateful. Systems that handle these phases as one homogeneous workload are leaving performance improvements on the table. This is why vLLM’s workflow actively encourages you to tune them separately. TTFT is optimized independently of inter-token latency in our dashboard. Its disaggregated prefilling feature exists precisely because those objectives often need different optimization strategies.
One of the most misleading metrics in LLM operations is “GPU presence” without real GPU efficiency. A “busy” cluster can still have abysmal request throughput. Why?
Because real-world traffic is heterogeneous. Some prompts are short. Some are long. Some outputs terminate after twenty tokens. Some take hundreds. Static request-level batching struggles in this environment because the entire batch is often paced by the slowest sequence. When a request completes early, its slot sits idle until the entire batch finishes processing.
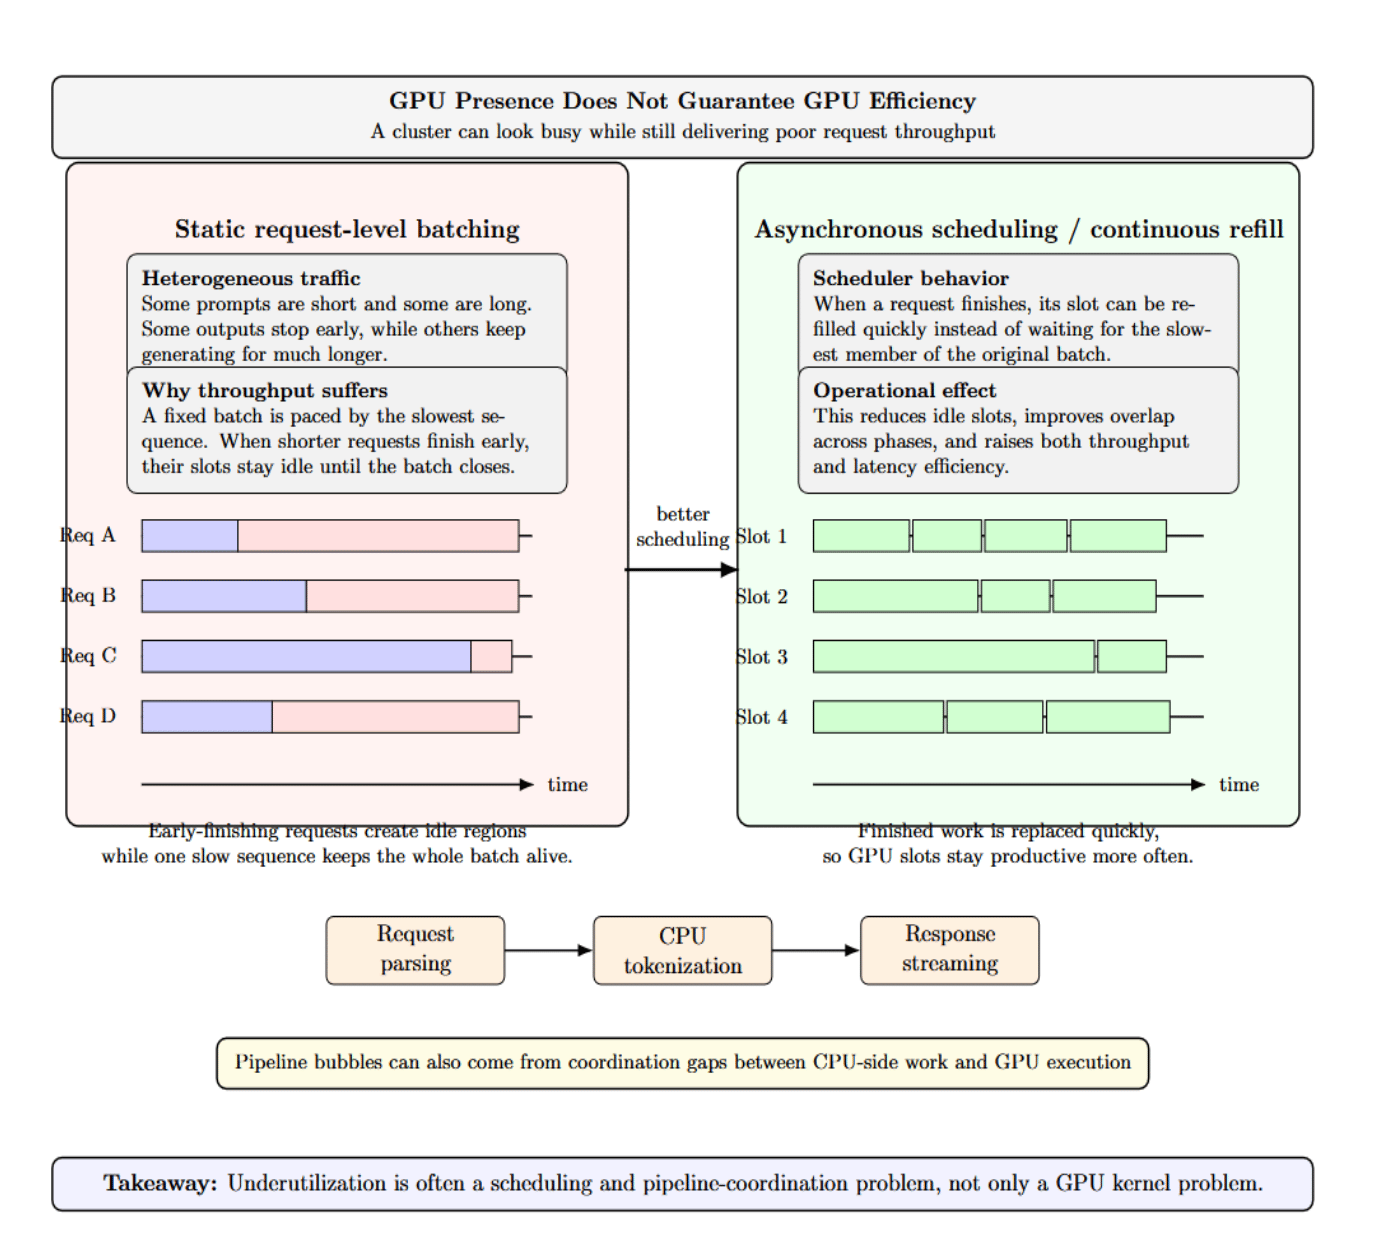
Idle time also happens between phases. CPU-side preprocessing, tokenization, request parsing, and response streaming introduce gaps where accelerators have to wait. vLLM’s serve documentation intentionally surfaces asynchronous scheduling to minimize gaps and increase latency and throughput. Remember: underutilization is not always a kernel problem. Sometimes it’s a pipeline coordination problem.
Purchasing a larger GPU won’t solve poor scheduling. If your requests are mismatched, if your batches are too rigid, or if the host pipeline can’t feed it, the more powerful accelerator will just sit there idly…waiting faster.
There’s a common mental model that says that inference is an FLOPS problem. The real picture is that “decode” often becomes memory-constrained before it becomes compute- constrained. Executing a model is commonly memory-bandwidth bound. Decode workers are memory-bandwidth bound because they issue tokens one at a time while repeatedly reading model state and KV data.
This explains why systems can show high memory allocation while still exhibiting low arithmetic utilization. GPUs can spend more time moving weights and KV-cache data around than doing computationally heavy tensor math while decoding. It’s also why high-bandwidth memory is so important when serving large models. The bottleneck is often the speed of feeding the next token step, not the peak matrix multiplication rate advertised on a product sheet.
The practical implication is that “GPU utilization” and “GPU efficiency” are not interchangeable. A deployment can appear loaded while still delivering poor tokens per second because memory traffic has become the dominant constraint.
Every serving team eventually faces the same temptation: we should probably increase batch size to get more throughput. You can do that! However, it might hurt the user experience. Larger batches usually mean better hardware utilization, but they often increase the time-to-first-token, tail latency, or inter-token latency if the prefills crowd out active decodes. Reducing the batched-token budget often improves inter-token latency, while increasing it often helps TTFT and throughput.
The presence of this tradeoff means a serving system should never be optimized using a single metric in isolation. TTFT is important if you care about chat responsiveness. Inter-token latency matters if you care about smoothness when streaming. Throughput is important for concurrency and efficiency. vLLM exposes TTFT, TPOT, ITL, end-to-end latency, percentiles, and goodput through our benchmarking and monitoring documentation because no single number fully captures inference quality.
The sweet spot depends on your workload. Interactive chat, batch summarization, agent pipelines, and offline report generation do not have the same latency envelope. Tuning without those goals in mind is a shot in the dark.
Different batching strategies aren’t created equal. Static batching groups requests together once, then processes them. Dynamic batching is more opportunistic about forming batches. However, it might not react fast enough to the generation-time variance. Continuous batching is different.
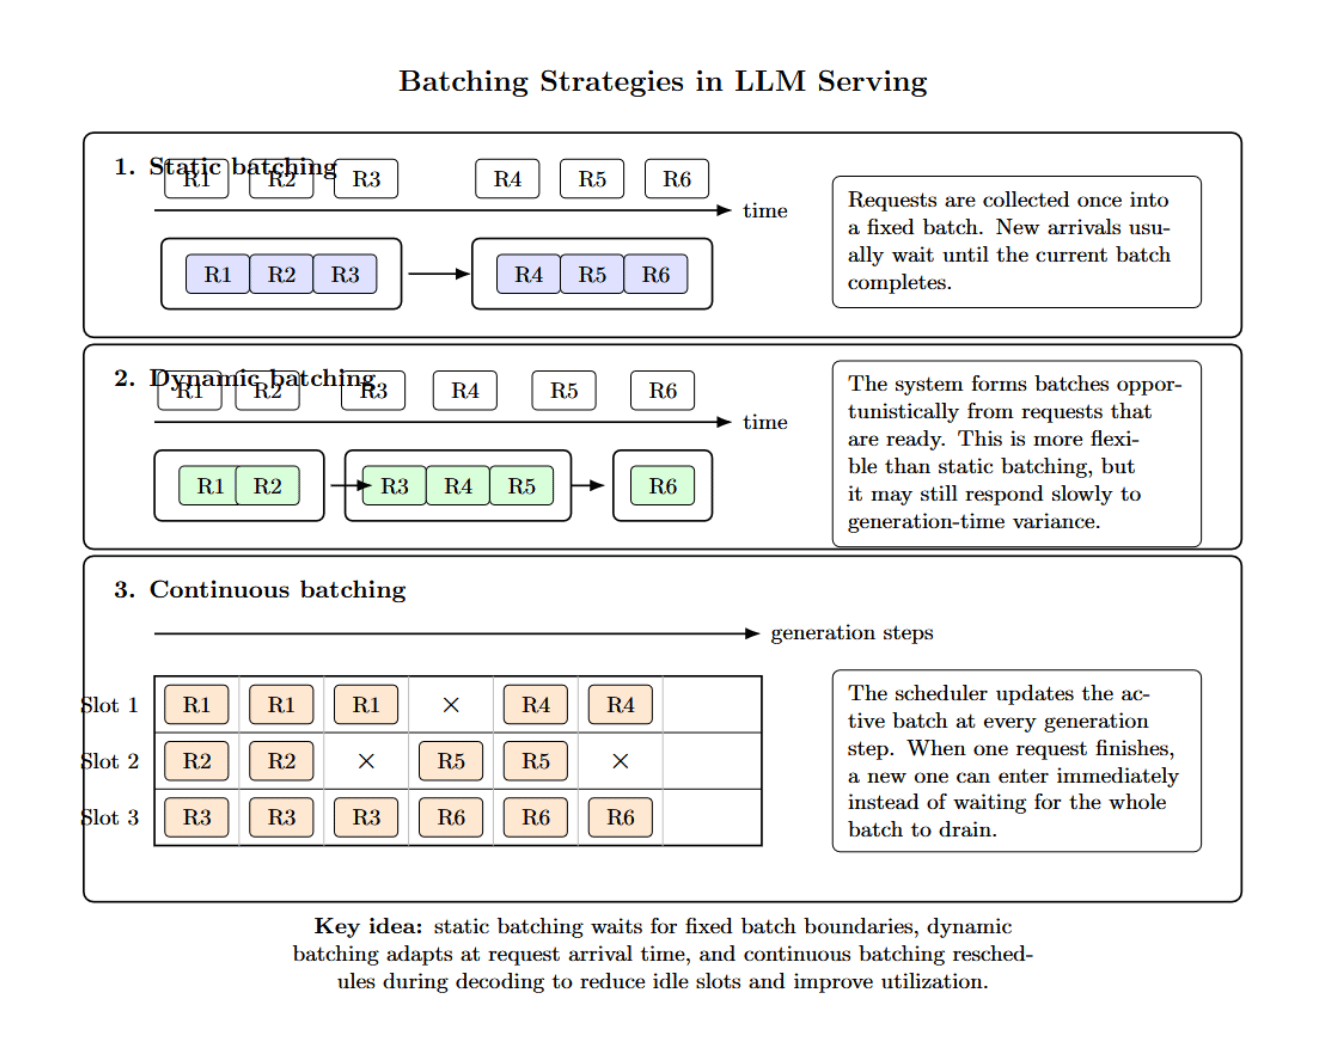
Rather than batch things up-front, it continually reschedules work during each generation step. As requests complete, new ones enter immediately rather than waiting for the batch to drain. The system dynamically reschedules the batch at every generation step to keep GPU utilization high.
KV cache is one of the largest factors influencing serving performance. It contains attention keys and values from previous tokens, so the model doesn’t have to recompute the entire history at every generation step. This reuse is necessary, but the cache itself can cause memory management headaches. It scales with context size, shifts across requests dynamically, and can be fragmented with traditional implementations.
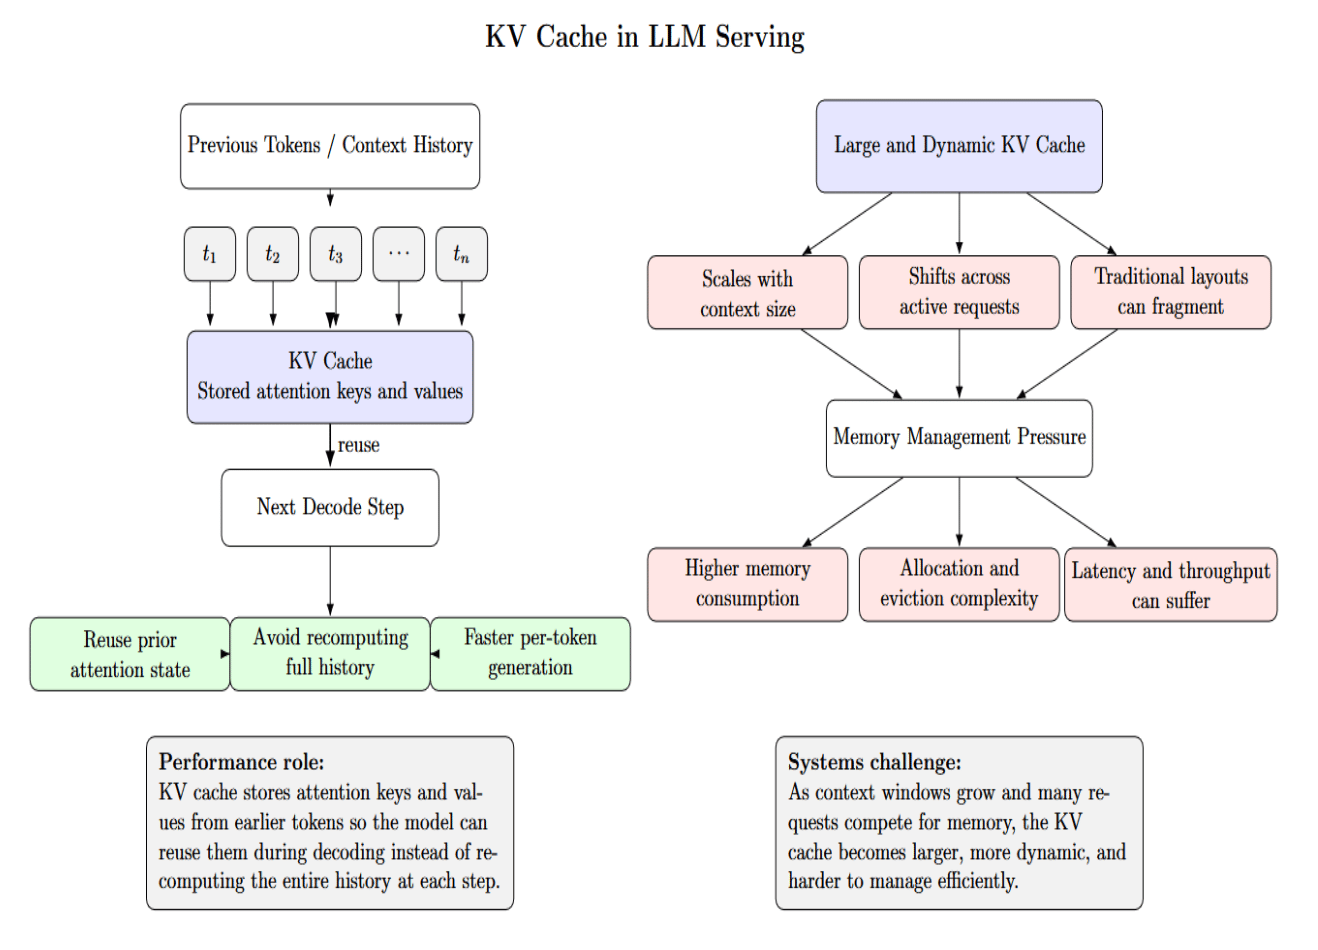
The PagedAttention paper was influential because it addressed KV-cache management from a paging-inspired perspective to reduce this waste and enable more flexible sharing patterns.
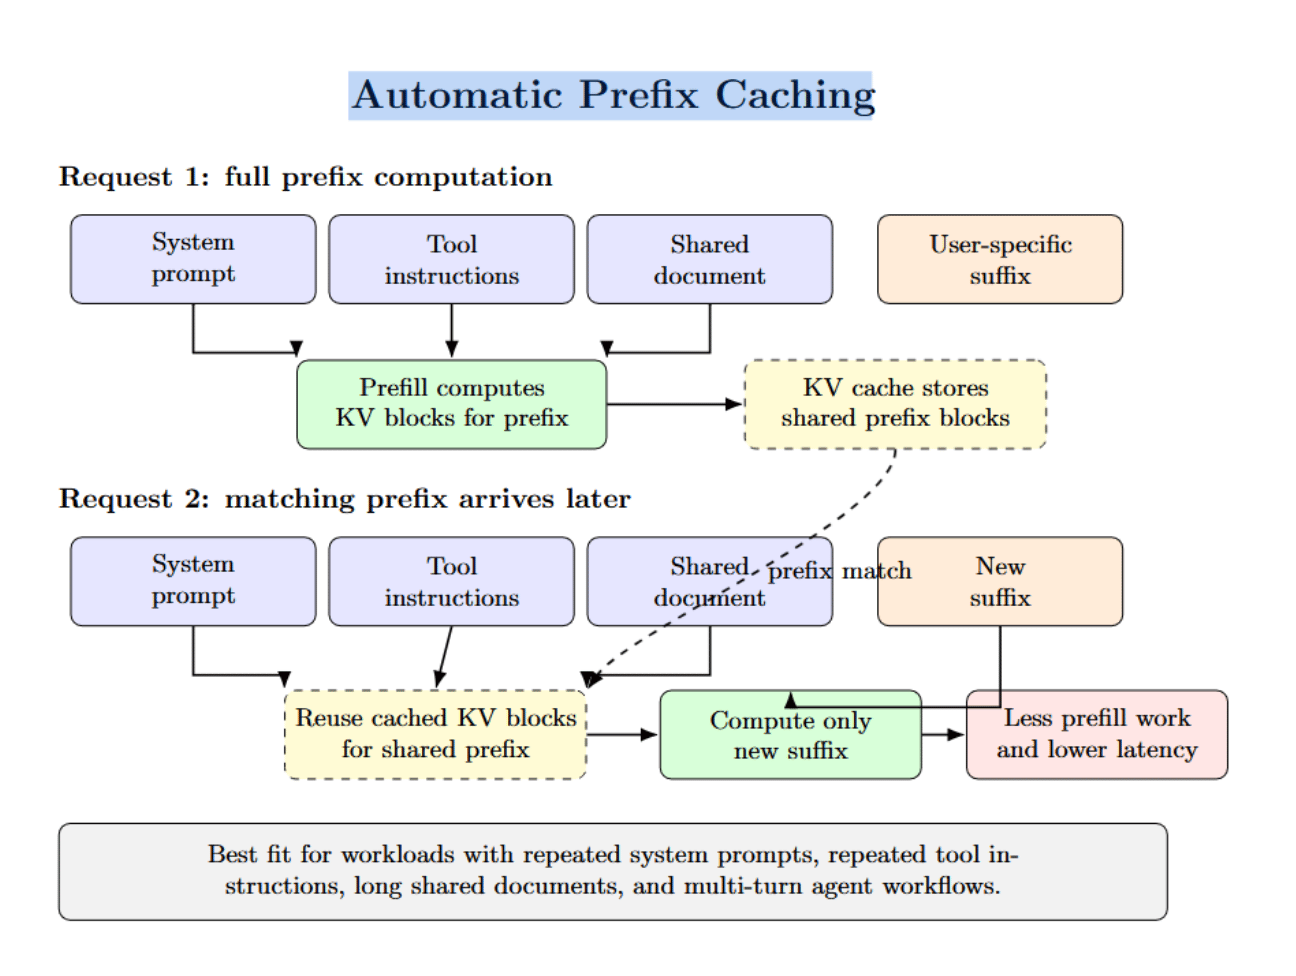
Automatic prefix caching refers to reusing cached KV blocks. Whenever a new incoming request has the same prefix as a prior cached request, the shared computation can be skipped. If the workload involves frequent repeated system prompts, tool instructions, long shared documents, or agent flows with many multi-turns, this can significantly reduce redundant prefill work.
Memory layout also plays a role here. For example, vLLM’s architecture couples prefix caching with block-based KV storage, and TensorRT-LLM’s documentation makes a point to differentiate contiguous vs paged KV caches. They define the effective cache capacity you have, how badly fragmentation hurts, and how well the scheduler can admit more work under concurrency. Let’s consider the following diagram:
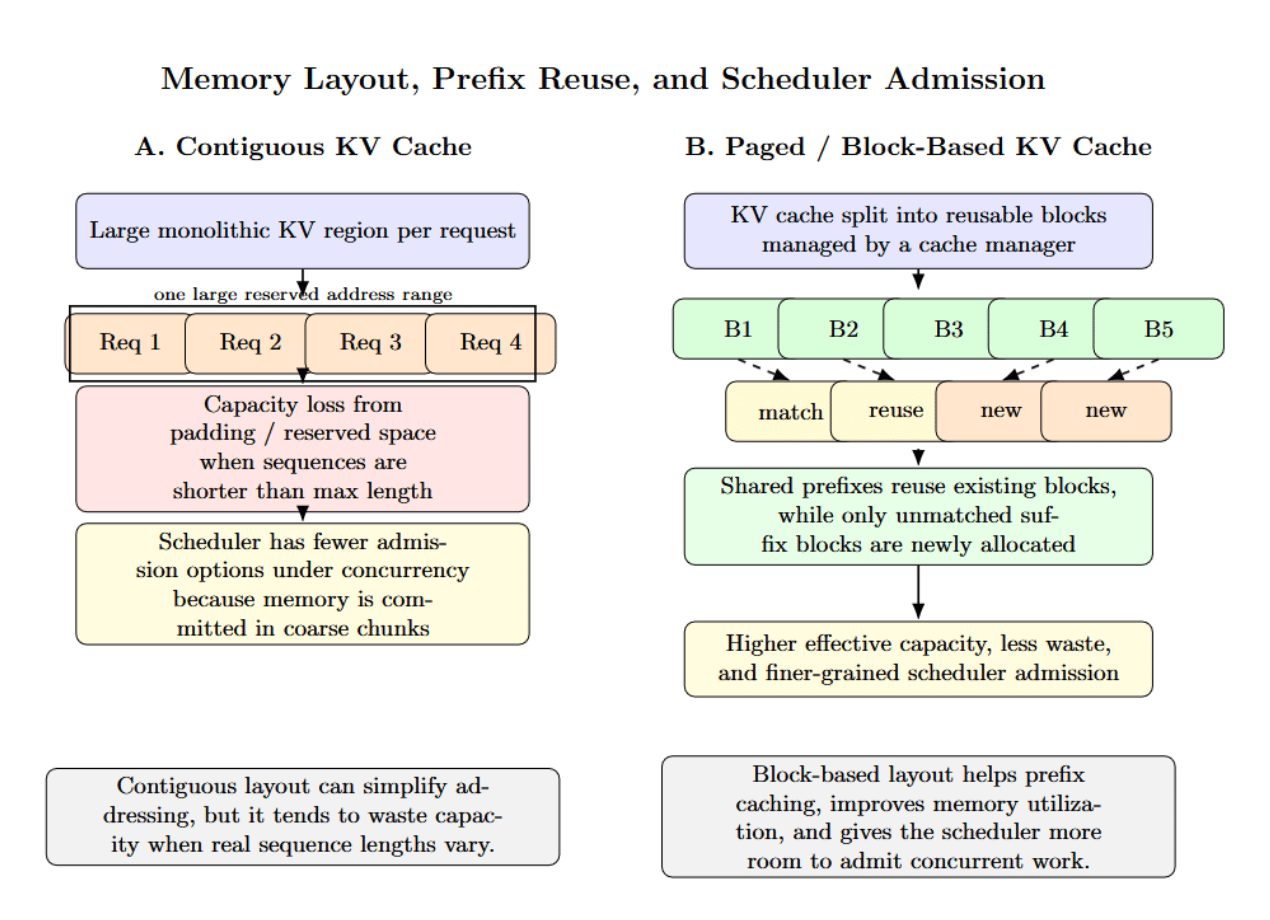
The above image illustrates, at a high level, two different KV-cache memory layouts possible for serving LLMs. The contiguous KV cache implementation reserves a single large memory region per request (On the left). While this is easier to implement, it will lead to significant capacity waste when request sequences have variable length. On the right, a paged or block-based KV cache breaks memory into reusable blocks, making prefix reuse easier, reducing waste, and giving the scheduler more flexibility to admit concurrent work.
Profiling only the GPU is a common mistake. Host-side pipeline latency can easily become your first-token bottleneck, especially with long prompts, agentic applications, or heavy middleware. Tokenization is the very first major step in your inference path. Modern tokenizer libraries are highly optimized. However, Hugging Face distinguishes between standard and “Fast” tokenizers precisely because the Rust-based implementations provide material benefits. The Tokenizers library documentation emphasizes production-oriented throughput and describes tokenization speeds below twenty seconds per gigabyte of text on server CPUs.
In production, tokenization is only part of the host overhead. Prompt assembly, template rendering, schema validation, request routing, log enrichment, streaming serialization, and post-processing all contribute to latency before or around GPU execution.
The diagram below shows that first-token latency is not just a GPU issue. It highlights how host-side steps such as tokenization, prompt assembly, validation, and routing can delay inference just as much as GPU execution.
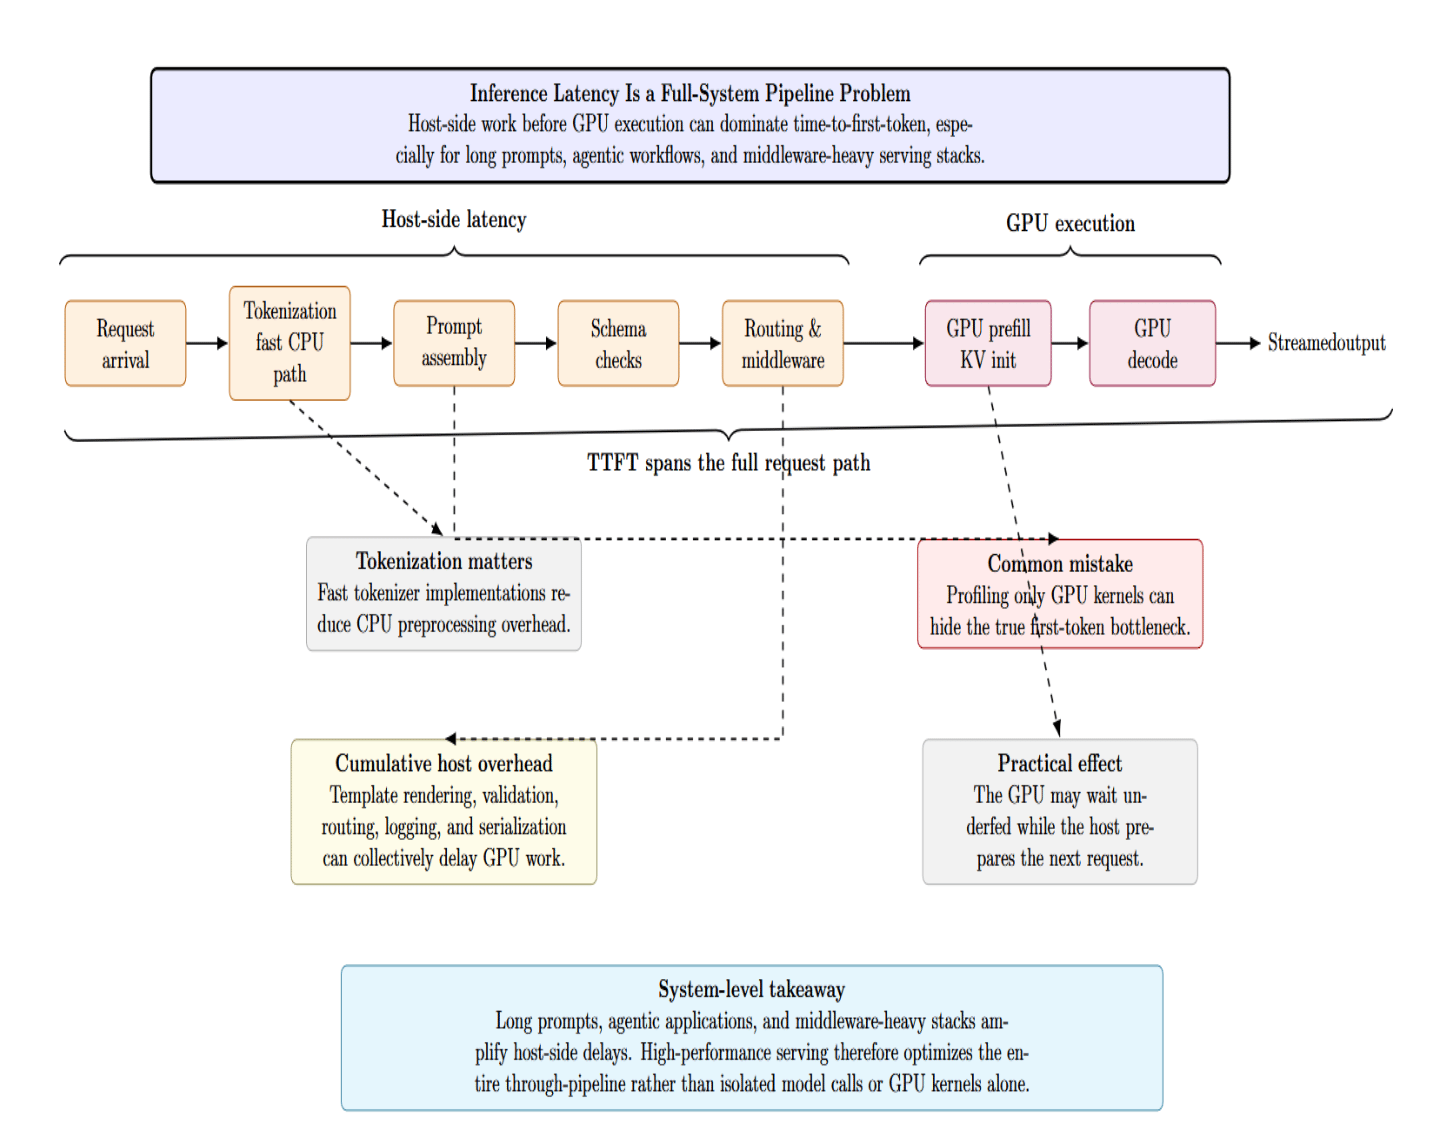
Each of these steps may appear minor in isolation, but they can cumulatively stretch TTTFT and introduce idle periods between batches. That’s why high-performance serving stacks treat the entire system as a through-pipeline these days rather than optimizing for individual model calls.
Modern LLM serving systems are converging on a common design centering around efficient batching, advanced KV-cache management, and dynamic scheduling. vLLM, TGI, and TensorRT-LLM are examples of moving away from naive implementations toward highly optimized, production-grade inference pipelines.
| Dimension | Traditional request-level serving | Modern serving design |
|---|---|---|
| Batching | Mostly static or coarse dynamic batching | Continuous or in-flight batching |
| KV cache | More fragile allocation, less reuse | Paged or block-based cache handling |
| Prefix reuse | Often limited or absent | Prefix caching supported |
| Prefill/decode handling | Treated more uniformly | Explicitly optimized for different phases |
| Scheduling | Less adaptive | Token-step or scheduler-driven admission |
| Operational focus | Basic serving | Throughput, TTFT, ITL, concurrency, observability |
This table summarizes the main practical steps for improving LLM serving performance. It highlights which metrics to monitor, which architectural changes to prioritize, and how to balance latency, throughput, batching, CPU overhead, and resource separation for better real-world user experience.
| Focus Area | Recommendation | Why It Matters |
|---|---|---|
| Metrics | Measure the right metrics together: TTFT, inter-token latency, throughput, end-to-end latency, and tail percentiles. | Looking only at average throughput can hide a poor user experience. |
| Serving architecture | Change the serving architecture before changing the hardware. | Software-level improvements often solve latency and utilization problems more effectively than hardware upgrades. |
| Interactive workloads | Prefer continuous or in-flight batching for interactive workloads. | This generally improves responsiveness for chat-style applications. |
| Repetitive prompts | Enable prefix caching when prompts are highly repetitive. | It avoids recomputing shared prefixes and reduces redundant work. |
| Large prompts + active decode | Enable chunked prefill when you need to balance large prompt ingestion with ongoing decode traffic. | This helps blend compute-heavy prefill with memory-bound decode more efficiently. |
| Batch-size policy | Tune batch size against service-level goals, not theoretical maximum occupancy. | The largest possible batch is not always the best choice for real user experience. |
| Chat latency | If chat latency is high, decrease the token budget that lets long prefills preempt active decodes. | This can improve responsiveness for active users. |
| Raw throughput | If you need higher raw throughput for batched workloads, increase the batch size carefully. | Higher throughput may come at the cost of worse tail latency. |
| CPU-side profiling | Profile the CPU path as well, not just the GPU path. | Bottlenecks before the GPU can delay first-token delivery. |
| Tokenization and preprocessing | Use faster tokenizers, reduce unnecessary prompt transformation, and remove serialization or post-processing before the first token is delivered. | These optimizations reduce host-side latency and improve TTFT. |
| Resource separation | Decouple prefill and decode resources when your scale makes it worthwhile. | Prefill and decode stress hardware differently, so separating them can improve efficiency and control. |
1. What causes GPU underutilization in LLM inference?
GPU underutilization is mainly caused by heterogeneous request lengths, inefficient batching strategies, CPU-side delays, and poor scheduling that leaves idle gaps between operations.
2. Is LLM inference compute-bound or memory-bound?
It depends on the phase. Prefill tends to be compute-bound. Decode is often memory-bandwidth bound because of the repeated KV-cache access.
3. What is the difference between prefill and decode?
Prefill takes the entire prompt and feeds it in parallel. It also initializes the KV cache. Decode autoregressively generates one token at a time, re-using the KV cache. It is typically iterative and stateful.
4. How does continuous batching improve performance?
Continuous batching refers to continuously updating your batch at every generation step, allowing new incoming requests to fill in the batch “slot” immediately as soon as it becomes available. This keeps GPUs fed continuously during inference.
5. What is KV-cache reuse, and why is it important?
Key-value caching is necessary to prevent recomputing attention on previously tokens. Techniques like prefix caching reuse shared prompt segments, reducing latency and improving throughput.
For large language models, the largest performance bottlenecks often aren’t even the model weights themselves. Bottlenecks are typically due to system design choices at the intersection of tokenization, prefill, decode, kv cache management, batching policy, and scheduler behavior. That is why teams can spend more on GPUs but still feel disappointed by production LLM inference performance. The serving system, not just the accelerator, dictates whether hardware is being utilized effectively.
The most effective improvements usually come from system design choices: continuous batching instead of rigid batching, paged or block-based KV-cache management instead of wasteful allocation, prefix caching instead of repeated prompt recomputation, chunked or disaggregated prefill when workloads are mixed, and end-to-end measurement instead of a single utilization metric. In other words, faster inference comes from engineering the pipeline intelligently. Better GPUs help, but better serving architecture is what turns that hardware into real user-facing speed.
 This work is licensed under a Creative Commons Attribution-NonCommercial- ShareAlike 4.0 International License.
此内容由惯性聚合(RSS阅读器)自动聚合整理,仅供阅读参考。 原文来自 — 版权归原作者所有。