





Update 06-21-2022: Eleven new System Log events have been added to the Github project to bring the total number of cataloged events to a lucky 777.
When I started writing this post, there were 766 potential System Log types that can appear in System Log, the logging platform in every Okta administrative console.
By the time I finished it, there were 768. Things move fast in the cloud.
While the most important of these events are well documented already, the significance of others are only understood when you look them up. There must be an easier way to enrich this data!
The native way to leverage Okta’s System Log is via the Okta Admin console.
Okta offers numerous ways that System Log can be streamed, exported or programmatically queried. Many Okta customers send the log entries to their log management or SIEM of choice. These logs are provided in nicely formatted nested JSON. System Logs can either be ingested using the Okta System Log API or streamed using Okta’s Log Streaming service, and specific logs can also be sent to an external service using Okta’s Event Hook feature. Partners like Databricks have published blog entries on ingesting System Log data, and Microsoft and Google have published Okta System Log connectors. Splunk has an entire Technical Add-On devoted to Okta System Log, complete with Common Information Model mapping.
We’ve published a number of resources about Okta System Log to help customers understand the more important entries for security monitoring and common administrative tasks. For example, we have write-ups on the events emitted by Okta ThreatInsight and on events that can be used to monitor for account takeover attempts. This search link will allow you to see all Okta Knowledge Base articles that reference System Log - there are plenty more gems in there.
Many SIEM, security analytics, and log management solutions have ways of adding enrichment to events, either upon ingestion or upon query. Elastic does this upon ingestion. Microsoft Sentinel has the concept of watchlists, and IBM’s QRadar provides reference data sets. Google Chronicle offers both: via references or directly in the parser during ingestion - more about this later.
Both Splunk and Sumo Logic call this functionality “lookup tables”. Since Okta maintains a Technical Add-On for Splunk (TA), I thought it might be helpful to extend the existing TA to leverage a custom .csv lookup that provides significant additional enrichment to System Logs as you search them in Splunk.
While this is designed for Splunk, the same methodology – and the same .csv file – should be applicable to many other SIEM/log management solutions.
An important note! Splunk is, at the time of this writing, taking over responsibility from Okta for the Technical Add-On for Splunk. Once this new TA releases in the next month or two, I will evaluate it, and ensure that the .csv file above remains compatible, at which point I will update this post. Also, this new TA will be Splunk Cloud certified.
As you search in Splunk for each of the System Log events defined in the .csv, this solution enriches them automatically with the following new fields, using the field format_event_type as a matching key.
event_type_description: The full-text description of the event.
event_type_tags: The various tags (pipe-delimited) that the event is categorized under, such as “admin” or “oauth2” or “workflows.”
admin_interest: A field set to “1” if the event is pertaining to admin-level activity, such as the modification of an email template, or the creation of an app sign-on policy.
security_interest: A field set to “1” if the event has particular security interest, such as the identification of a threat within ThreatInsight, or the start of a support technician impersonation session. This incorporates, and extends, the Okta Events categorization found here. (Note: events can be of both admin and security interest.)
legacy_event_types: The various former event types that mapped to this event, pipe-delimited.
Once this lookup is loaded into Splunk, it can be viewed quickly via the inputlookup command, as shown below.
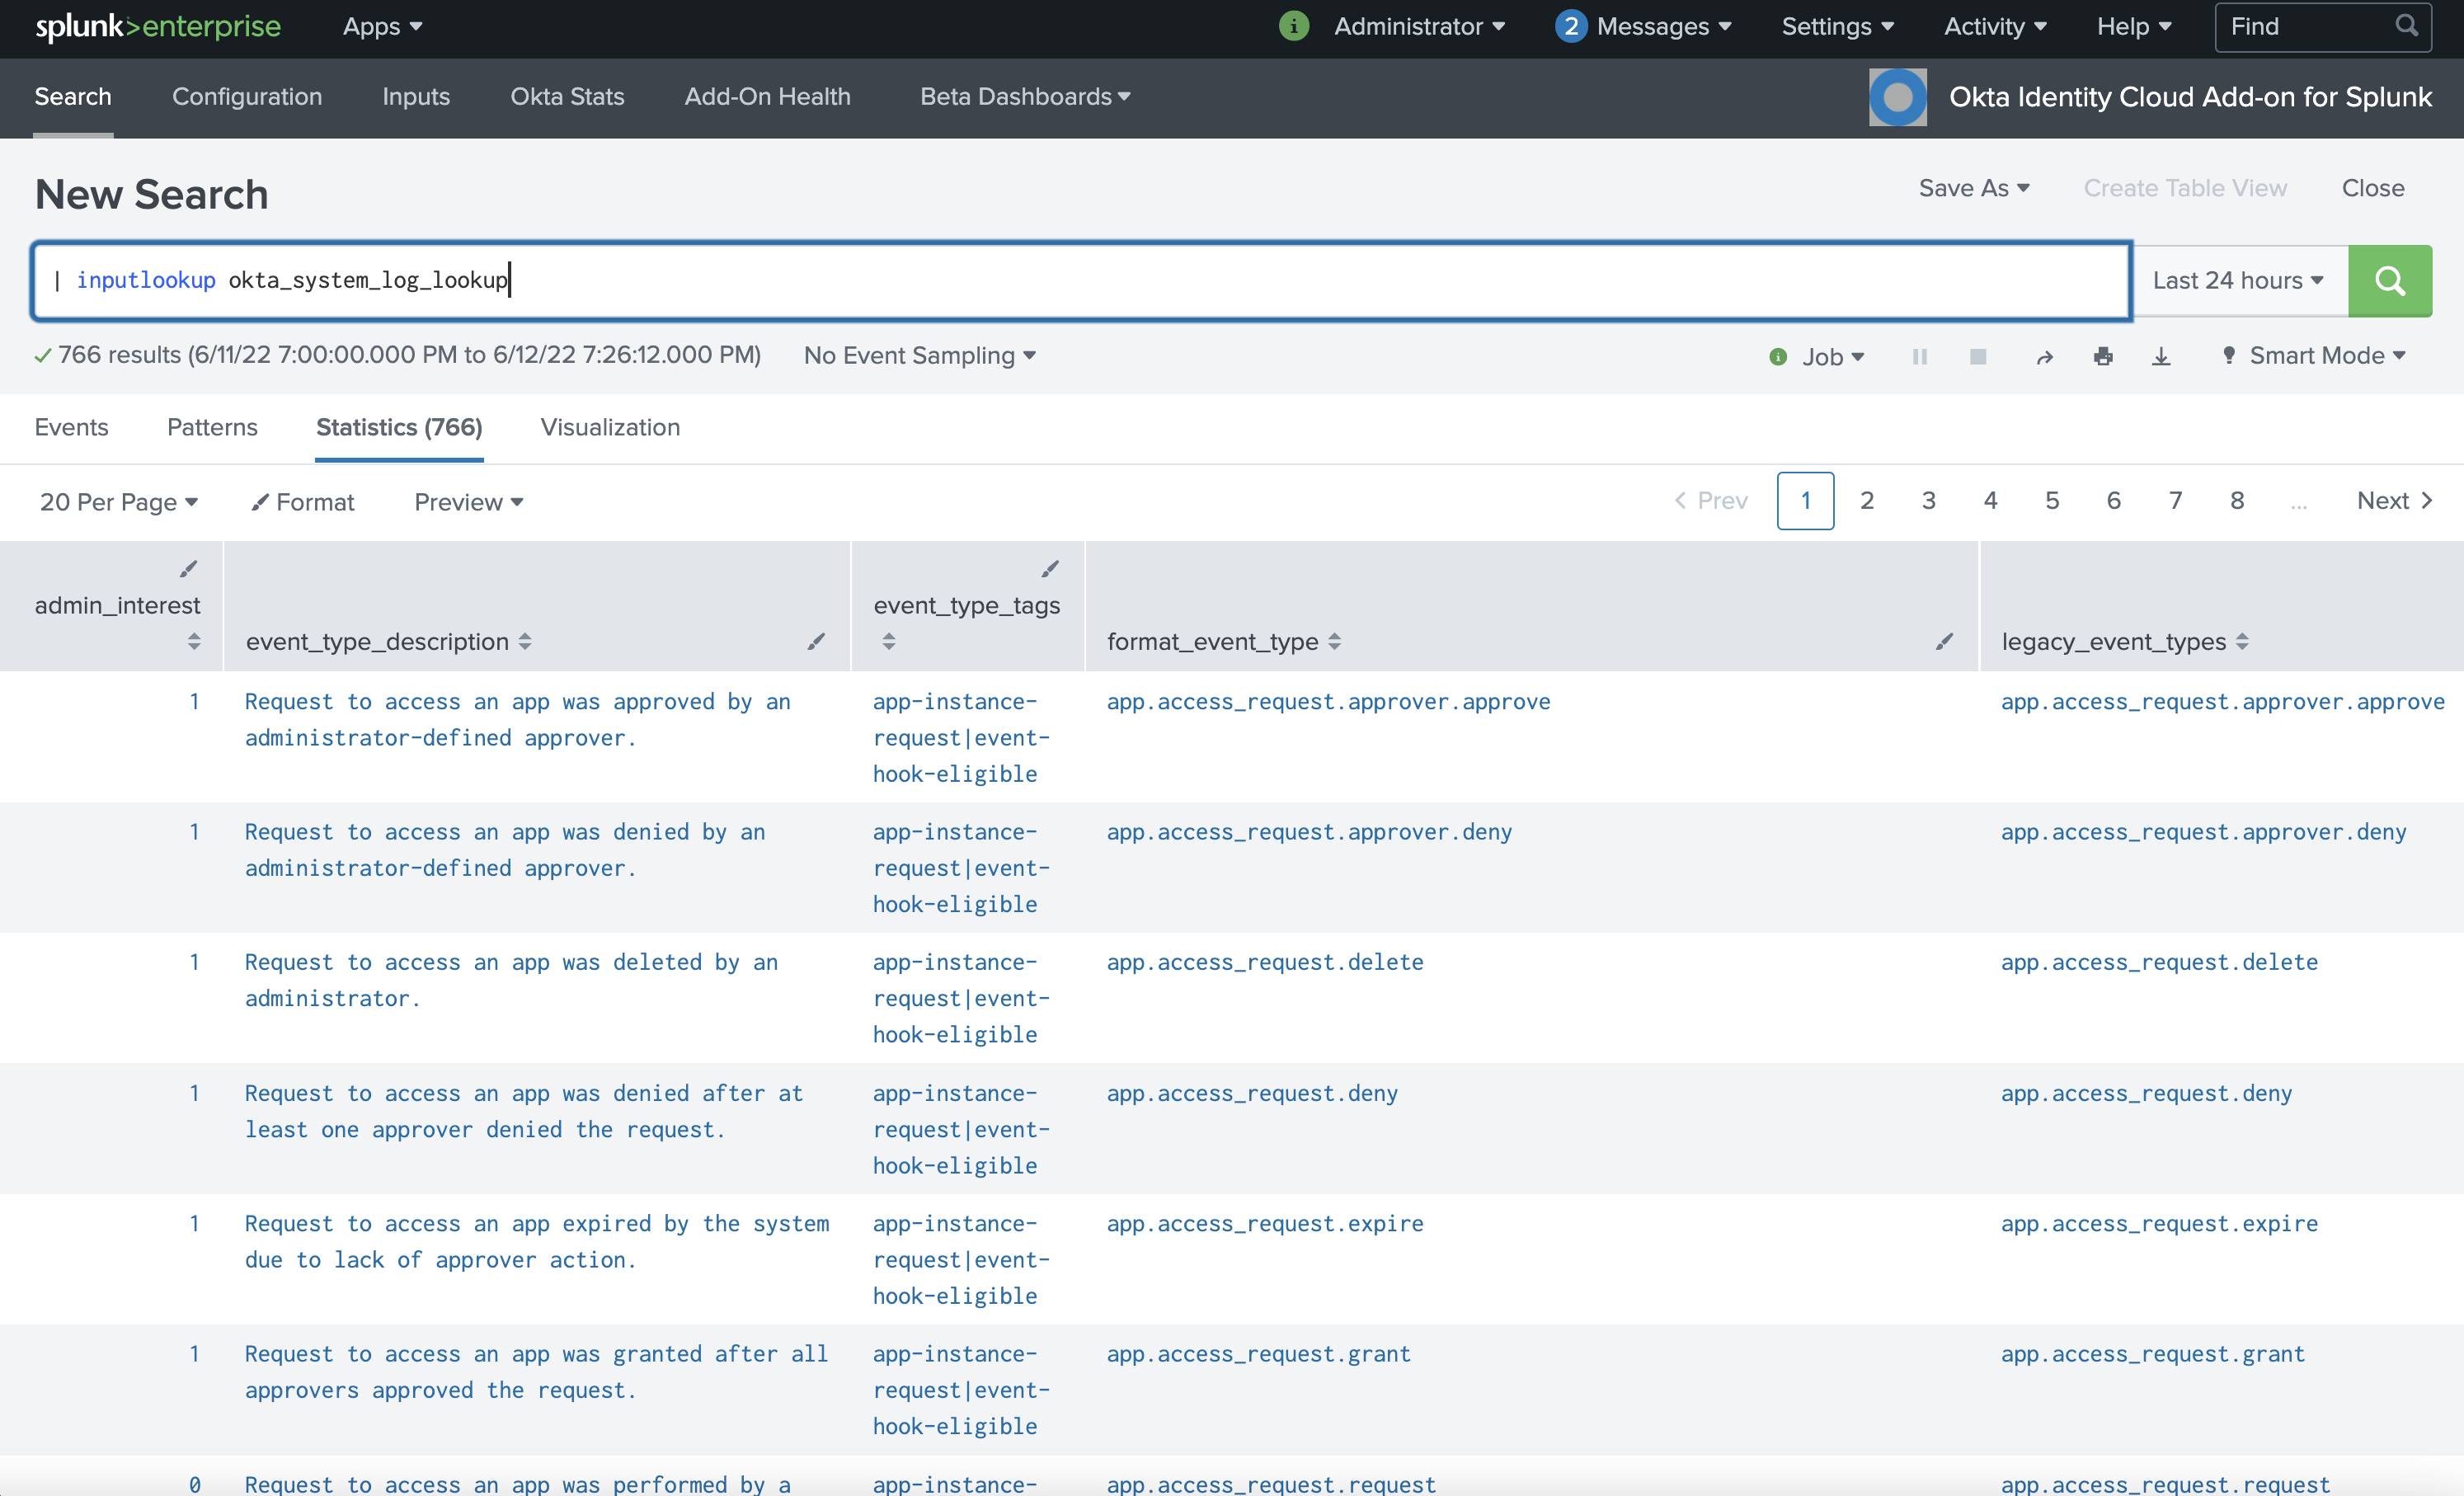
Splunk console, using inputlookup command
With this lookup in place, Okta admins or security personnel searching this data in Splunk no longer have to pivot out of Splunk and view Okta’s Event Type Catalog to understand what an event means, or if it is of admin and/or security interest. Reports, dashboards, and detections can be created leveraging these new fields. Security teams in particular can easily build dashboards of Okta events that are of interest to them, and can create alerts or “notable events” from particularly important security events.
As an example to get you started, also provided at the GitHub link above is a usable dashboard that displays all events of admin or security interest. Multi-select dialogs at the top of the dashboard allow the viewer to select event categories and tags of interest, as well as free-form search the events returned. Here’s a screencap!
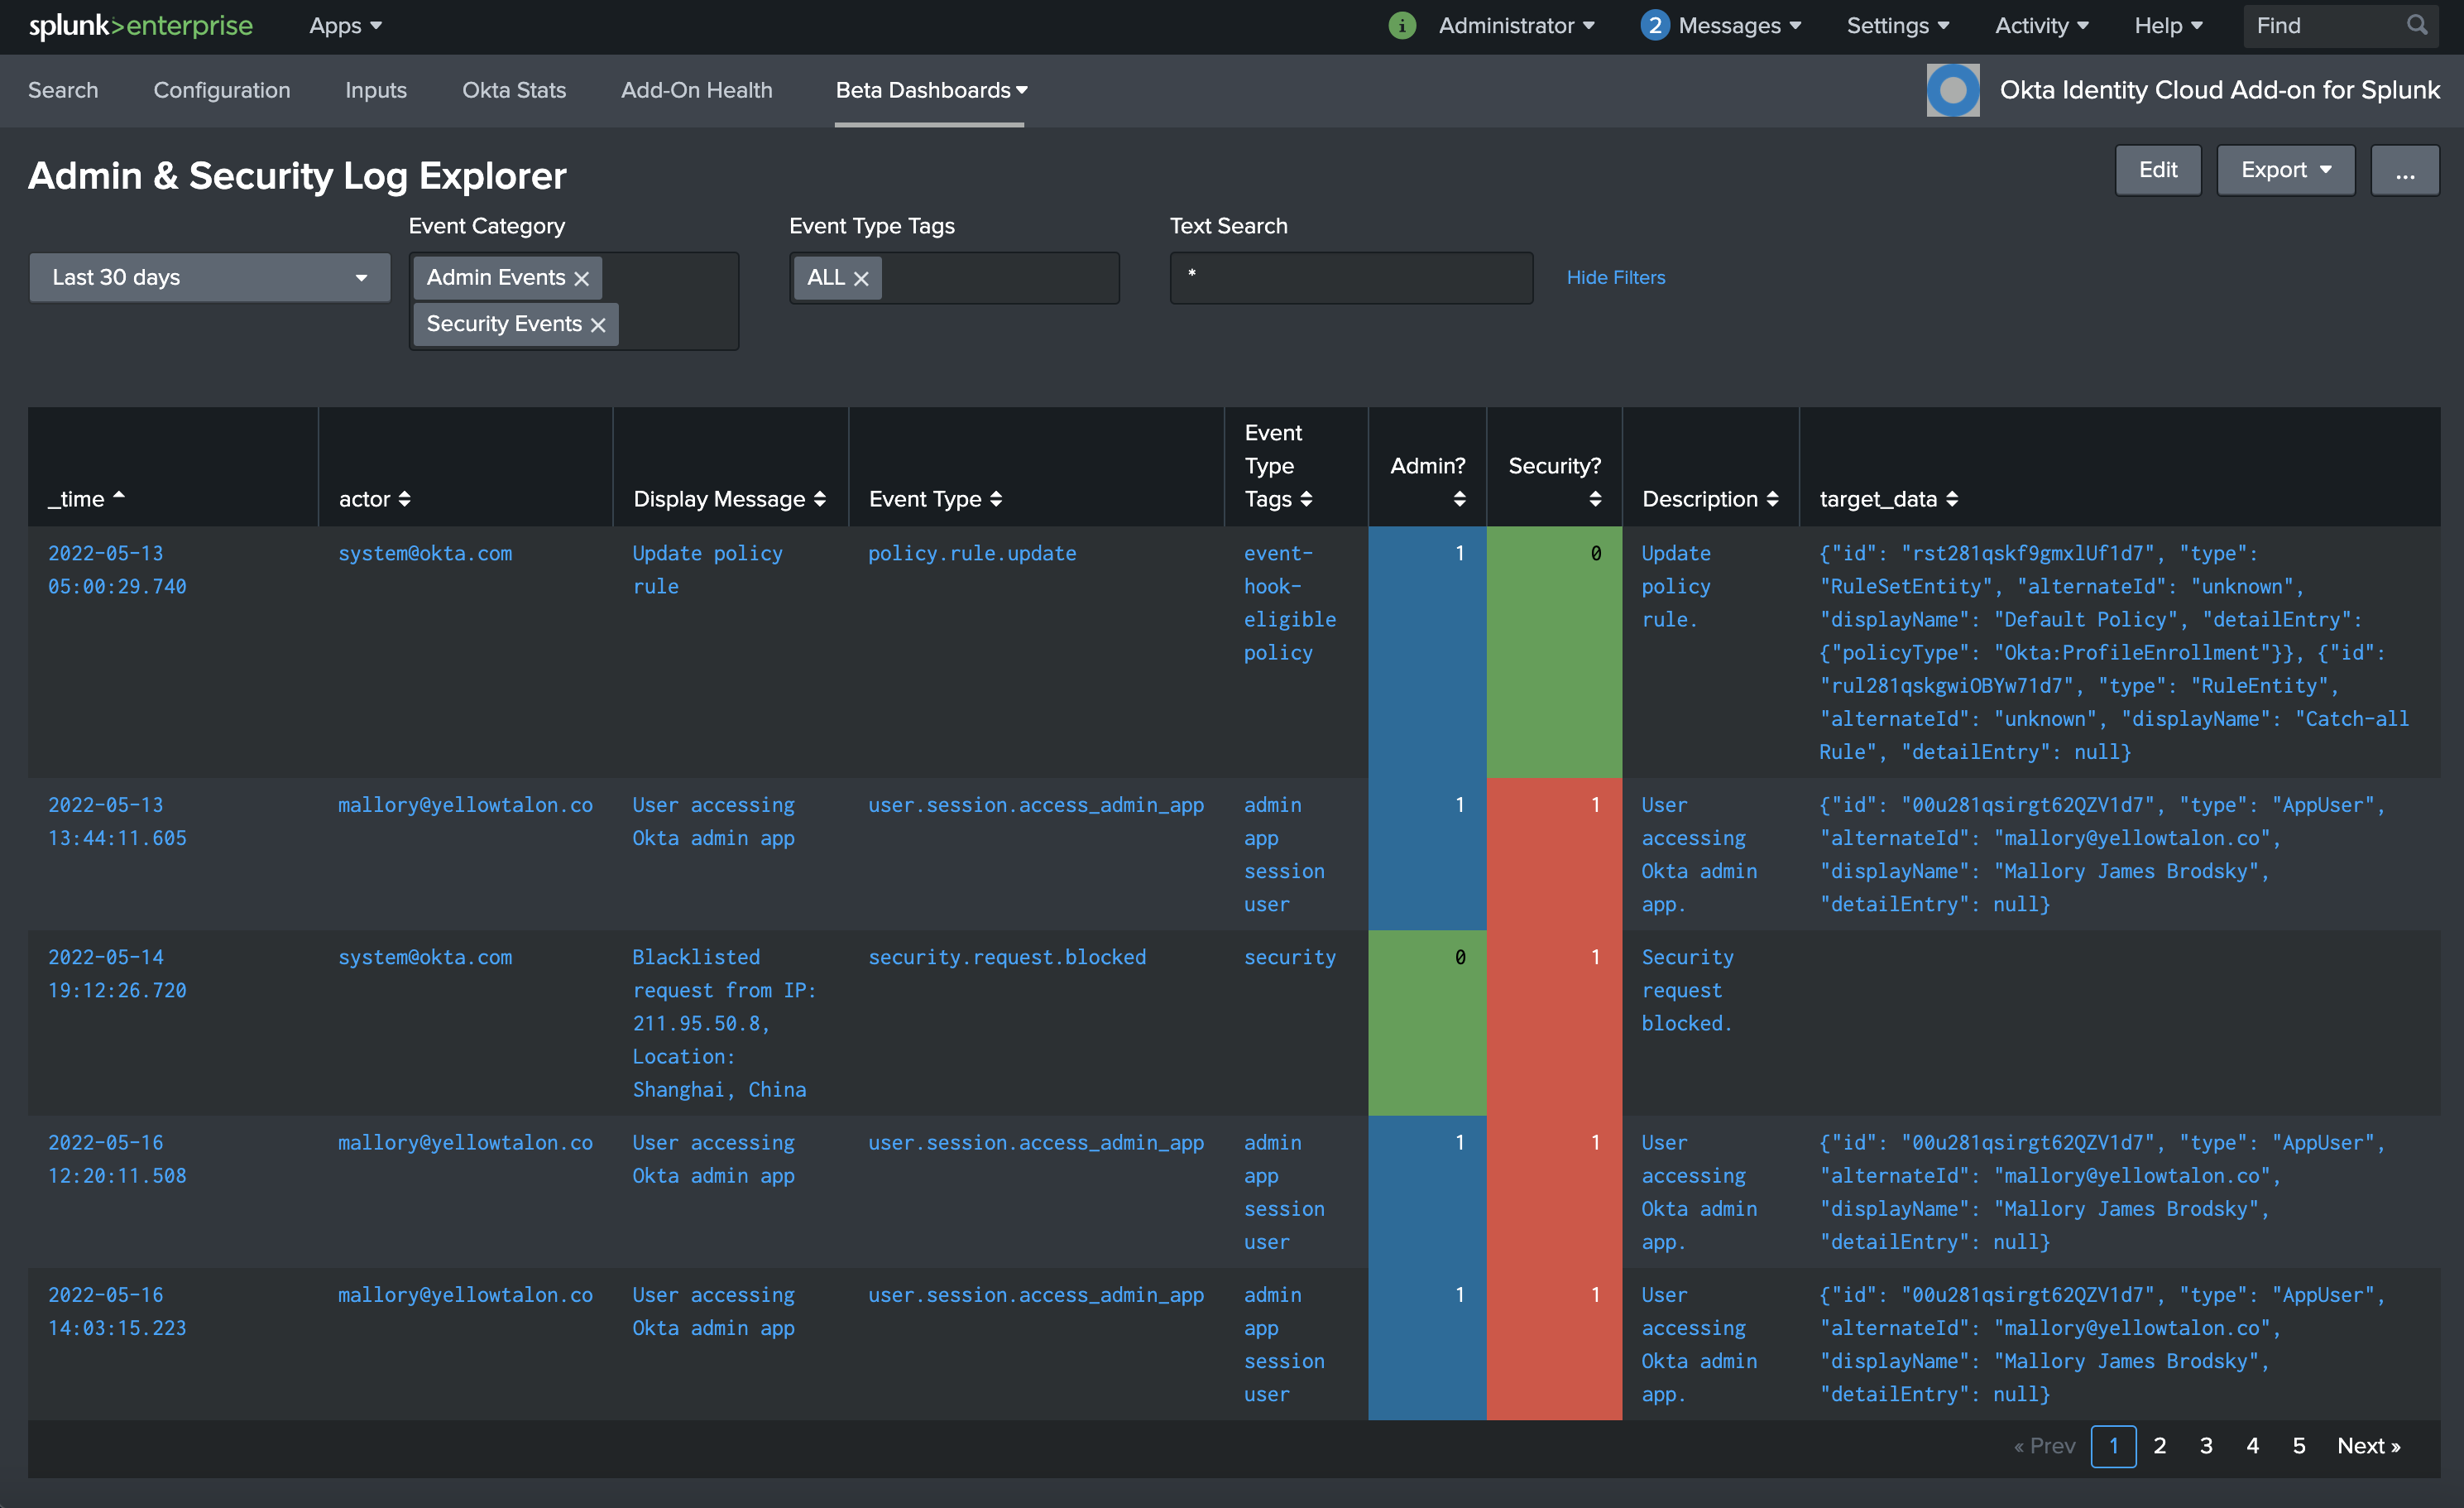
Sample Dashboard, using enriched events of interest
If you don’t use Splunk, you may still leverage the .csv file in order to build your own parser or reference table for the SIEM or log management platform of your choice. We reached out to our friends at Google Cloud Security, who took the .csv file and built it into a new version of the parser that brings Okta System Logs into Google Chronicle.
Chronicle feeds operate much the same as feeds in any other SIEM. However, the capabilities and goals diverge quickly once the data is ingested. In Chronicle, the parser adds metadata fields and populates the Universal Data Model fields needed for Chronicle operations to happen on the data. This happens at ingest time, so any time dependent data are added to the meta of that log and are able to persist over the life of the log. If we were to change the event_type_description, or security_interest of a log at a later date, the values would remain the same for older logs and be updated for new logs.
Operating within Chronicle, you can use both raw and structured search. When combined with the new fields admin_interest and security_interest, structured search allows the operator to quickly select only the relevant logs using Procedural Filtering combined with Prevalence on domain, user, or asset occurrence. Without using a search language, the operator can also find the most frequently occurring username generating logs of security_interest. For more information on enrichment, check out the Chronicle documentation on user investigation.
I hope this foray into enrichment methods helps you get even more use out of this valuable resource.
If you create dashboards based on the additional fields, feel free to create a pull request against the Github project so that we can include it in the repo.
And if you create enrichment capabilities for another SIEM, I’d love to hear about it - please DM me at @james_brodsky.
I serve as a global resource for Okta’s high-growth solutions engineering organization. I have been at Okta since January, 2022 - but I’m no stranger to the industry! My team brings our customers a better awareness of Okta’s capabilities when it comes to protecting employees and business, increasing your security posture and giving your customers a frictionless-but-safe experience as they interact with you digitally.
此内容由惯性聚合(RSS阅读器)自动聚合整理,仅供阅读参考。 原文来自 — 版权归原作者所有。