


There was a time when “Opus” meant a classical composition and “Sonnet” was fourteen lines of Shakespeare you definitely did not read before the test. Now they’re model tiers, and every new release rewrites the economics of your engineering org whether you’re ready or not.
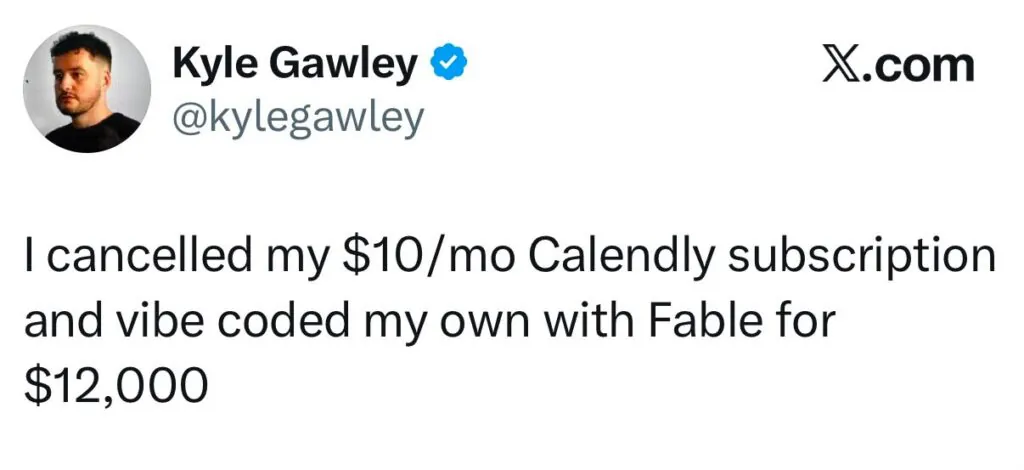
Currently, your monthly total hides the crucial information you need to control and justify AI spend. Crucial information includes which repositories that spend went toward, whether the generated code was actually accepted, which engineers are consistently running the most expensive session shapes, and whether any of that activity maps to outcomes you can defend in a budget conversation.
The bill is one number. The story behind it remains invisible. (How’s that for Shakespeare!?)
In reality, usage-based billing behaves nothing like a seat license. The most engaged engineers, the ones supposedly getting the most value out of the tool, are also the ones who can generate token costs an order of magnitude higher than expected. That is a governance gap, not a product problem.
Filling that gap requires connecting coding agent telemetry to the rest of what is happening across your teams, repositories, and production infrastructure. A standalone spend tracker cannot tell you whether that session produced code that shipped, whether a cheaper model would have handled the same task, or whether the spend hit a company repository at all.
Today Coralogix is introducing: Code Agent Usage Intelligence. It sits inside the Coralogix platform and connects coding agent activity to the observability layer you already have, without the need to instrument anything new. Claude Code, Cursor, Codex, and Gemini CLI already emit OpenTelemetry data natively on every session: every API call, every tool call, every token. Coralogix is built OTel-native from the ground up, which means that signal lands directly in the same pipeline as your logs, metrics, and traces, no translation layer, no separate ingestion path, no stitching dashboards together after the fact. Here is what it gives you and why each piece matters.
Every session is broken down by who ran it, which tool they used, which model they selected, and what it cost at the turn level.
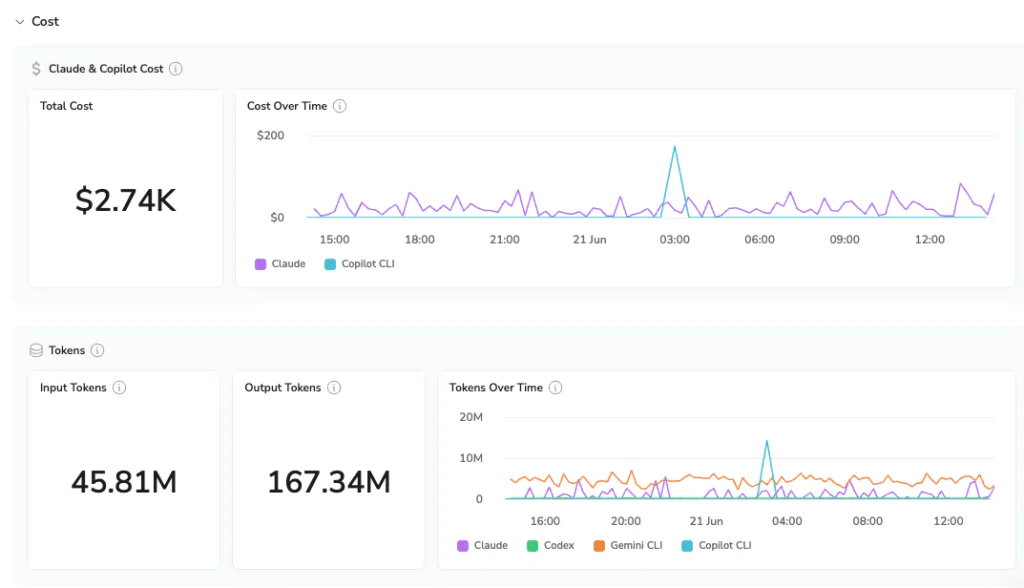
You can see which engineers are driving the most token burn and whether that spend is concentrated on a handful of power users or distributed across the team.
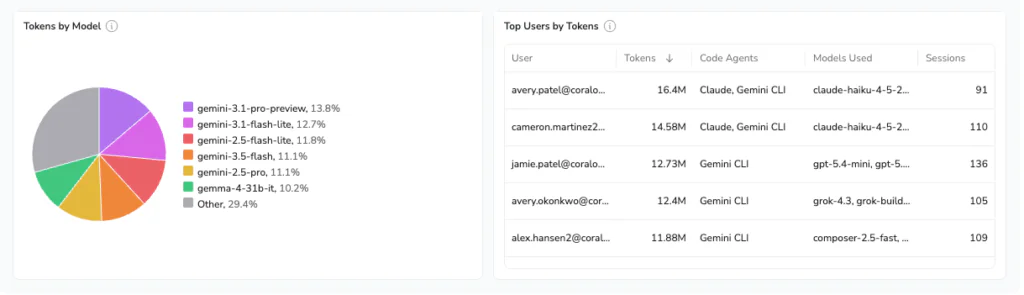
For FinOps teams, this answers not “what did we spend on AI last month” but “who spent it, on what, and is that aligned with where we planned to invest.”
Every session is mapped to a GitHub repository, and Coralogix automatically classifies repos as managed company projects or unmanaged and personal ones. If a significant share of your AI spend is hitting unmanaged repos, you see it before the next billing cycle.
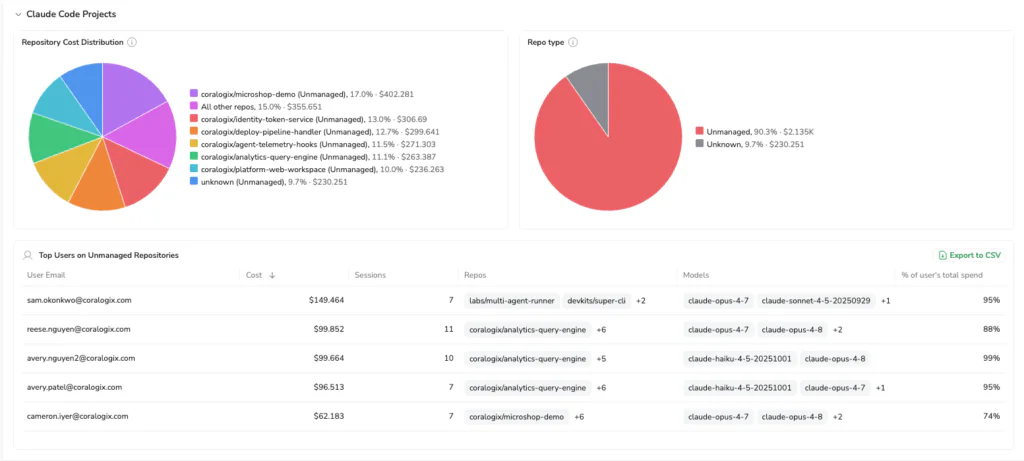
Not only does unmanaged repo spend have no line back to a business outcome, but also, code written against personal or external repositories may not be subject to your IP policies, data handling requirements, or export controls. Compliance and FinOps teams get an answer they currently have no way to obtain.
Anomaly detection also flags usage patterns that fall outside normal session behavior which can indicate misuse or shadow AI activity that has not been sanctioned.
Every coding agent interaction is logged with full session context: user, model, repository, tool calls, cost, and timestamp. That record does not live in a separate tool. It lives in the same platform where your logs, traces, and security events already sit.
Generated code, accepted code, and code that reaches production often have a discrepancy between them. Coralogix tracks all three, so you can compare what the agent produced to what the engineer actually kept and what ultimately shipped.
When you need a plain-language breakdown of what a user actually worked on, Olly, the AI-agent built into Coralogix, surfaces it on demand. You can ask which engineers used the most expensive model in the last 48 hours, what repositories they worked on, whether those repos are managed, and where a cheaper model could have handled the same task. You get a complete answer in seconds, with manager-ready guidance attached.
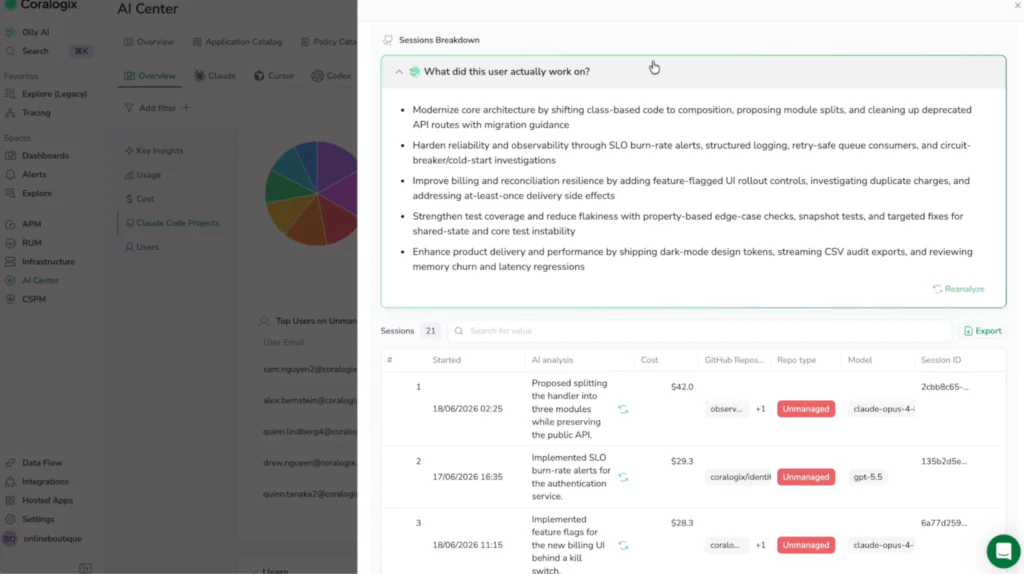
The dashboard tells you what happened. Olly and the CLI tell you why.
When a spend spike surfaces or a session pattern looks off, ask Olly things like which users ran the most expensive sessions, whether those sessions hit managed repositories, and where a lighter model could have handled the same workload. You get a complete answer in seconds, not a filtered table you have to interpret yourself.
The CLI extends that same investigation to the agents and workflows already running in your environment. Claude Code, Cursor, and scripted pipelines can query your code agent data directly, with a semantic layer that resolves field names automatically and returns structured results built for agent consumption.
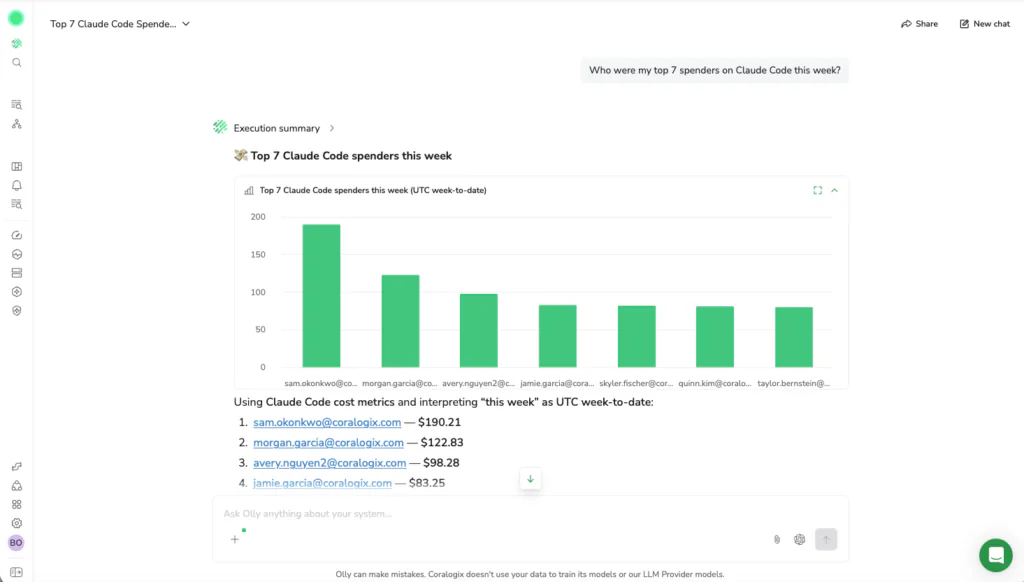
The investigation question is almost never “what is the total.” It is “why did this team’s spend double in four days, what were they building, and should we adjust their model allocation before next month.” That question spans AI signals, repository data, and session context simultaneously. Olly and the CLI are the only way to answer it without stitching tools together after the fact.
The industry moves fast. New models drop, pricing changes, and “token-maxxing” goes from a developer joke to a line item in your quarterly review before anyone has written a governance policy for it. The teams that got caught flat-footed were the ones still figuring out their Claude Code budgets when the next release landed.
Coralogix was built for exactly this. Our architecture processes telemetry at ingest, which means when the model landscape shifts overnight, you are not waiting on re-indexing or retroactive dashboards. You have the visibility to respond, optimize, and justify spend in real time, whatever the current model tier happens to be called.
The signals are already there. The only question is whether you are reading them.
此内容由惯性聚合(RSS阅读器)自动聚合整理,仅供阅读参考。 原文来自 — 版权归原作者所有。