


For years, telemetry worked one way: everything lands in one massive, undifferentiated pool. It scaled until it didn’t, observability users suffer from:
That era is over.
Coralogix is launching Dataspaces and Datasets: a data layer that gives teams structured control over how observability data is organized, routed, secured, and billed, without changing how you send telemetry. And with this launch, that structure is also yours to shape: with user-defined datasets, you can create a dataset for every team, service, or use case, each with its own schema, access, retention, and quota.
One stream in, governed and contextual data out. Dashboards that stay fast as data grows. Costs that map to teams, not spreadsheets. AI agents that reason precisely instead of guessing across terabytes.
Nothing changes how you send data. No new agents, no SDK changes, no re-instrumentation. You keep sending telemetry as a single stream, and Coralogix handles the logical segmentation on the platform side.
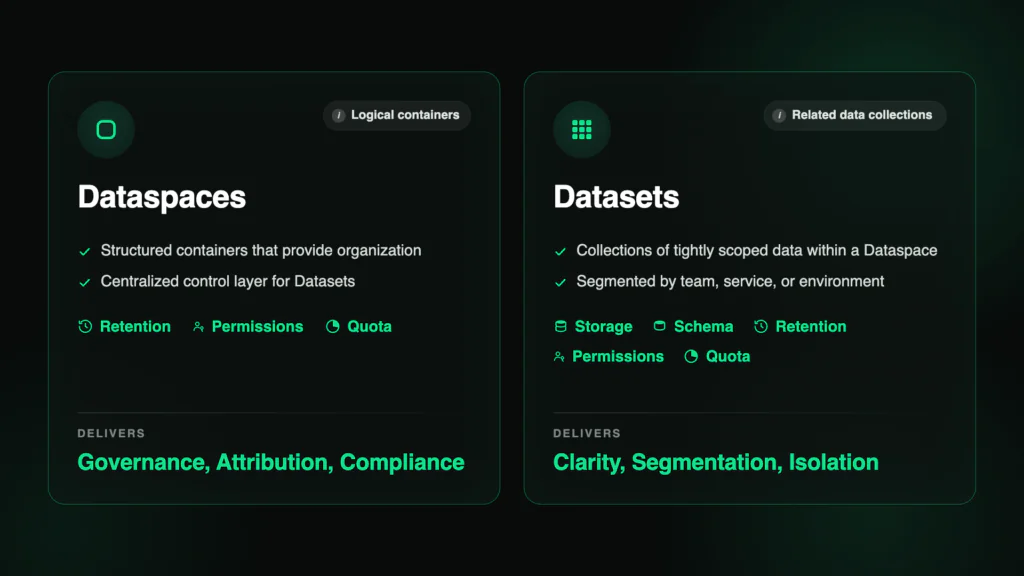
Everything you send lands in the default dataspace, while the system dataspace exposes the platform’s own telemetry as queryable datasets.
Now, with user-defined datasets, you can carve that structure to fit your org: the payments team works in default/payments, the security team governs default/security-audit, and FinOps sees exactly how much each domain ingests.
User-defined datasets come in two forms, built for two distinct jobs: ending data chaos and making query results permanent.
Streaming datasets route raw incoming data into named datasets using granular DataPrime expressions in the TCO Optimizer. You can also route programmatically with writeTo – a DataPrime command that sends query results directly to any dataset on the fly. Route by any field, any condition, any business logic – not just application, subsystem, and severity. A single log can even fan out to multiple datasets when compliance and operations need different views. No other observability vendor offers expression-driven routing on arbitrary fields.
And every dataset is self-describing: it records why it was created and what belongs in it, so both engineers and AI agents can judge relevance before scanning a single row.
Summary datasets solve a problem every team knows: query results that vanish the moment they execute. Run a Background Query, save its results to a dataset, and point your dashboards at pre-aggregated data instead of re-scanning raw logs on every load. A terabyte of raw logs becomes a few megabytes of summary; load times drop from minutes to seconds and stay there as data grows. (Migrating from Splunk? This is your summary index, native.)
The System Dataspace (system/) exposes Coralogix’s own behavior as governed, queryable datasets – observability on observability. It includes system datasets like :
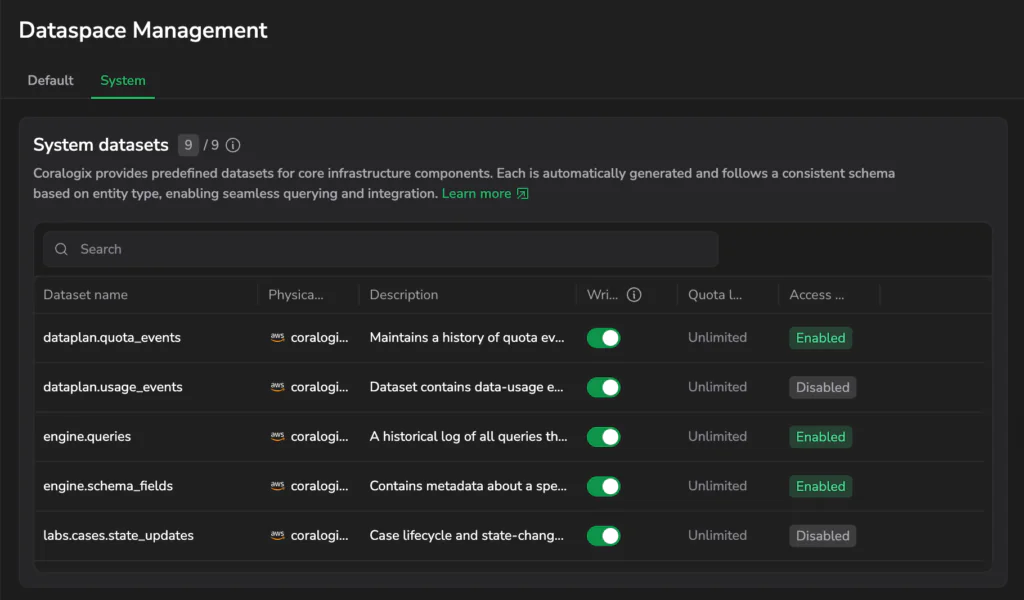
engine.queries – every query executed in your account, with performance and execution contextaaa.audit_events – a full audit trail of account activity for compliancedataplan.usage_events – data usage metrics as a queryable datasetSee the full list of system datasets and how they work here.
What used to require a support export – adoption trends, heavy queries, audit reviews, schema drift – you can now query yourself with DataPrime, from inside your account. With this launch, that same battle-tested architecture extends to the data you define.
Everything above is live right now. Start using user-defined datasets today:
writeTo, and fan a single log out to multiple datasets when compliance and operations need different viewsThis is the data layer AI-native observability runs on, and it’s live in your account today. Send your data the way you always have. Shape it around the way your teams actually work. And give every engineer and every agent data they can finally trust.
Join the webinar on July 16th
此内容由惯性聚合(RSS阅读器)自动聚合整理,仅供阅读参考。 原文来自 — 版权归原作者所有。