




OpenTelemetry won the architectural standards battle. At scale, though, telemetry breaks more like plumbing than code. It breaks quietly, across a graph, with a blast radius you don’t understand until it’s expensive. With over 65% of organizations now running more than 10 collectors in production, hybrid deployments across Kubernetes and VMs are accelerating fast. Telemetry standardization is no longer a project milestone. It is a baseline expectation. (Source: OpenTelemetry Collector Follow-up Survey, Jan 28, 2026)
Crucially, with scale comes a shift in bottlenecks. Growing an observability estate today means introducing specialized data routes, multi-region pipelines, PII redaction rules, tail-sampling criteria, and cost-tier definitions across isolated business units. At that point, your OpenTelemetry configuration has evolved into a distributed data supply chain inheriting every operational problem that comes with one.
In the OpenTelemetry Collector Follow-up Survey, 61% of respondents rate the experience of building and maintaining collector configurations as complex or neutral. This means that the majority of the industry is operating a critical data plane without adequate authoring infrastructure. They need a structural map, so teams don’t fall back on tribal knowledge.
This persistent friction point surfaces only after OpenTelemetry is already running in production. When configuration tooling forces engineers to mentally compile their architecture from thousands of lines of flat YAML, configuration management becomes a problem of active risk mitigation.
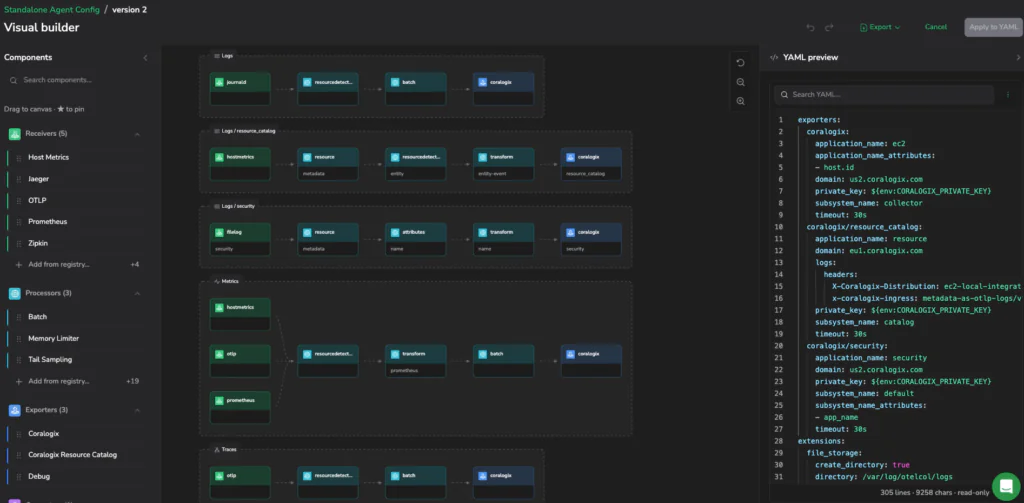
Managing modern telemetry infrastructure through configuration files is architecturally dangerous. When pipelines expand across signals and regions, engineers must manually compile their entire topology from flat text. There are no maps or guardrails. There is only the file. Specifically, we see four friction points emerge consistently across architectural reviews and post-incident retrospectives with enterprise platform teams running OpenTelemetry at scale.
1. Drift becomes the default
Multi-region collector deployments don’t stay synchronized by default. Platform teams respond with GitOps pipelines, Helm charts, and layered values.yaml overrides. Merging vendor-supplied templates with environment-specific requirements turns every variable change into a manual reconciliation exercise. For instance, in Kubernetes, overriding a single tail-sampling block means patching a Helm chart. In ECS on EC2, it means owning the entire master config. The more signals and environments, the more these templates diverge.
2. Topology is implicit (and authoring is blind)
An OTel collector pipeline is a graph: receivers ingest, processors transform, exporters deliver. Raw YAML encodes that graph as flat text with no structural representation. Traditionally, engineers have traced routing paths and dependency chains across thousands of lines, multiple pipelines, and signals manually. Onboarding morphed into a knowledge transfer problem as the architecture existed only in the minds of whoever wrote the config last.
3. Blast radius is unknowable
A Git diff cannot tell you whether a line change silently broke a routing path, dropped a telemetry stream, or introduced a cardinality dimension. Span metrics misconfigured without schema awareness can generate tens of millions of unique metric dimensions before anyone notices. When that happens, the only available response is force. You must block the entire data stream at the platform level and accept the visibility loss while you debug.
4. Cost controls become guesswork
Tail-sampling processors and regex transforms are the primary levers for cost control and PII scrubbing. Both are completely opaque to tune via raw text. The interdependencies between decision_wait windows, num_traces buffers, and live trace volume have no visual representation. A wrong setting will have the collector fall behind its own queue. When the processor can’t evaluate a trace against its policy within the decision window, it drops the trace with no warning or visibility. In a live incident, those are exactly the traces you needed.
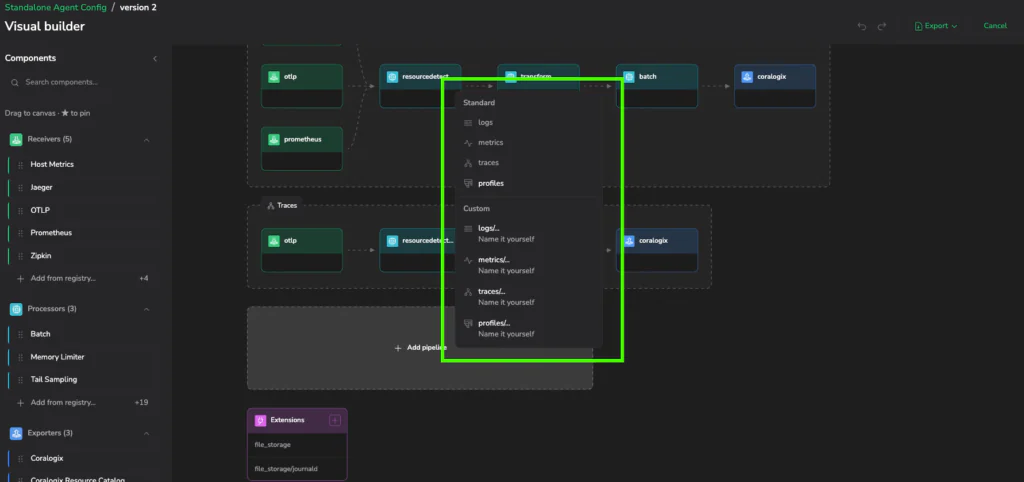
The main frustration is that the validation loop is completely decoupled from the authoring loop.
To verify a pipeline change works, an engineer must modify code, commit, deploy to a cluster, restart collector runtimes, then hunt for signals to confirm telemetry is flowing. Every iteration is a multi-step, multi-minute cycle of editing an invisible map with no feedback until the very end. The cognitive burden is on debugging the gap between what you wrote and what the pipeline actually does.
Git tracks lines but cannot tell you whether a one-line variable change silently reordered processor execution, broke a routing reference, or dropped a signal entirely. Even with a clean-looking diff, the pipeline is broken.
This is where the bus factor compounds the problem. Because topology lives in engineers’ heads rather than in any structural representation, telemetry expertise is concentrated within a small number of specialists. When they are unavailable, the platform stalls.
Rather than solving the underlying visibility problem, platform teams build defensive workarounds that create new ones:
Ultimately, these are less workarounds and more the structural symptoms of a data plane being operated without a control plane.
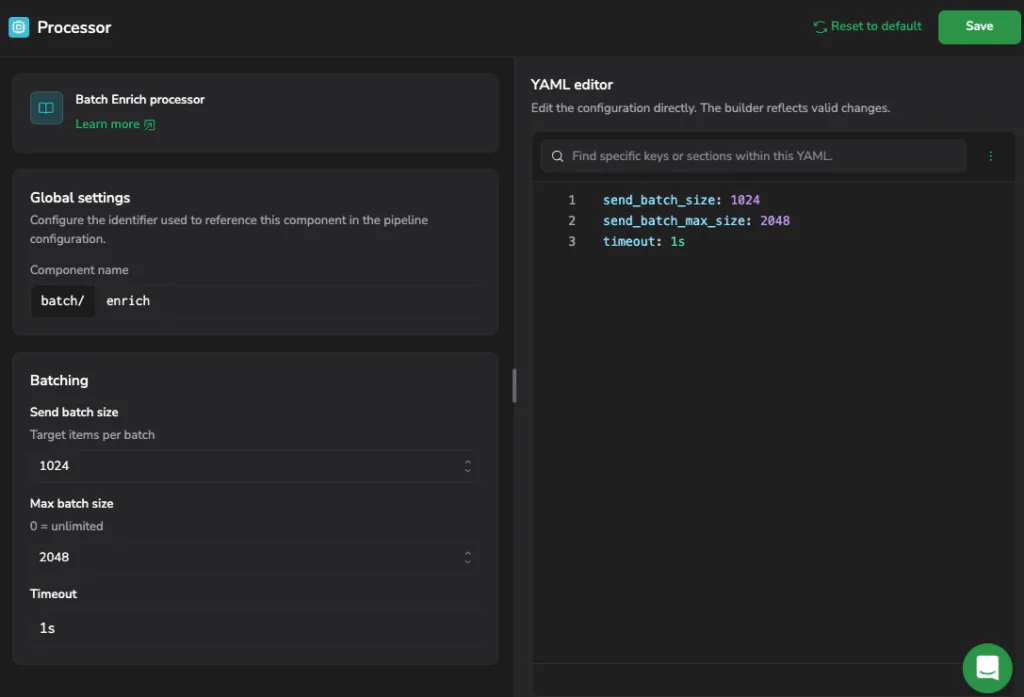
The industry has reached the shared conclusion that telemetry configuration is a graph problem being solved with a text editor. Some observability vendors use that gap as leverage forcing users to adopt proprietary configuration languages just to get a visual interface.
Replacing open standards like OpenTelemetry to fix the tooling problem just moves the risk from configuration complexity to vendor dependency.
The obvious objection is that visual tooling often comes with a hidden trade: proprietary configuration languages, black-box runtimes, or workflows that don’t survive a GitOps reality. Fixing authoring shouldn’t require replacing OpenTelemetry. It should make the existing graph visible, validatable, and safer to change.
Therefore, the correct move is an intelligent design layer on top of vanilla OpenTelemetry. This layer will make topology a first-class artifact without touching the underlying standard. That’s the architectural principle behind the Coralogix Visual Builder in Fleet Management. It makes the YAML graph visible, validates it before deployment, and compiles back to fully compliant OpenTelemetry collector configuration. This is all with no proprietary runtime, no format lock-in, and no break in the GitOps workflow.
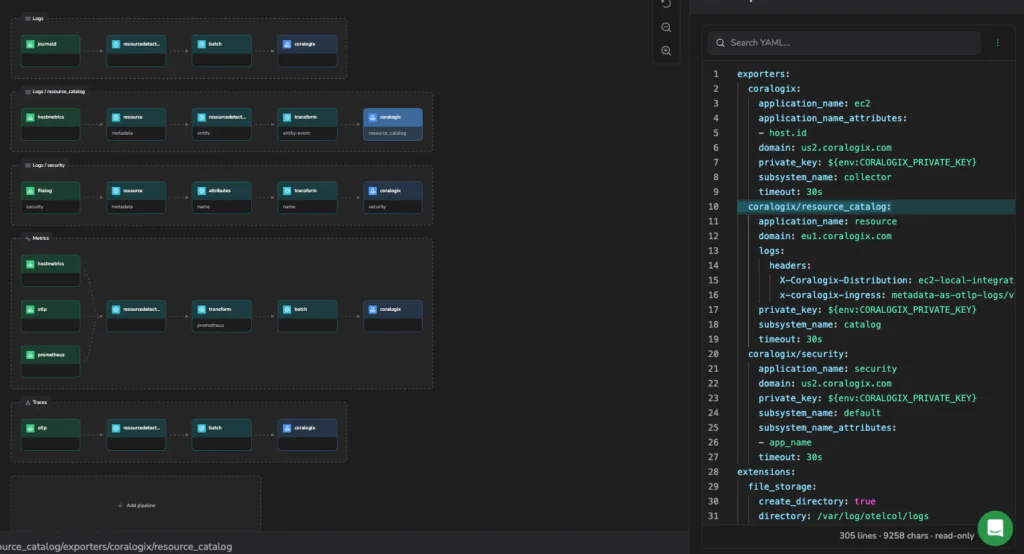
Each friction point described above has a direct structural answer. We are going beyond feature coverage to offer a one-to-one elimination of the operational risks that accumulate when topology is invisible.
Skeptical infrastructure teams treat visual configuration tools as abstractions that trade engineering rigor for convenience. The Visual Builder inverts that assumption.
The output is pure, vanilla OpenTelemetry collector YAML. No proprietary runtime. No black-box format. No break in the GitOps loop. An engineer can build a pipeline visually, drop into the YAML pane to hand-edit a field the form doesn’t expose, and apply it back as part of the same workflow.
The moment telemetry pipelines became a distributed infrastructure, they inherited the operational problems of distributed infrastructure. Kubernetes earned a control plane. CI/CD earned deployment gates and rollback primitives. In fact, until now OpenTelemetry pipelines were the exception. They were managed with the same flat-text workflows that worked when a single collector was a novelty. Visualizing topology isn’t a UX improvement. It’s how you make change safe in a distributed telemetry data plane.
此内容由惯性聚合(RSS阅读器)自动聚合整理,仅供阅读参考。 原文来自 — 版权归原作者所有。