

惯性聚合 高效追踪和阅读你感兴趣的博客、新闻、科技资讯
阅读原文 在惯性聚合中打开

推荐订阅源

美团技术团队
P
Privacy International News Feed
P
Proofpoint News Feed
Security Archives - TechRepublic
C
CXSECURITY Database RSS Feed - CXSecurity.com
Know Your Adversary
Know Your Adversary
Security Latest
Security Latest
Threat Intelligence Blog | Flashpoint
Attack and Defense Labs
NISL@THU
NISL@THU
cs.AI updates on arXiv.org
W
WeLiveSecurity
GbyAI
GbyAI
N
News and Events Feed by Topic
N
News | PayPal Newsroom
Y
Y Combinator Blog
C
CERT Recently Published Vulnerability Notes
N
Netflix TechBlog - Medium
S
Security Affairs
Spread Privacy
Spread Privacy
罗磊的独立博客
腾讯CDC
MyScale Blog
MyScale Blog
www.infosecurity-magazine.com
L
LINUX DO - 热门话题
The Cloudflare Blog
L
LangChain Blog
博客园_首页
H
Hacker News: Front Page
宝玉的分享
宝玉的分享
Martin Fowler
Martin Fowler
博客园 - 聂微东
SecWiki News
SecWiki News
A
Arctic Wolf
爱范儿
爱范儿
Google Online Security Blog
T
Threat Research - Cisco Blogs
Hacker News - Newest:
Hacker News - Newest: "LLM"
有赞技术团队
有赞技术团队
The GitHub Blog
The GitHub Blog
Cyberwarzone
Cyberwarzone
博客园 - 叶小钗
V
Visual Studio Blog
V
V2EX
T
Tailwind CSS Blog
Project Zero
Project Zero
T
The Blog of Author Tim Ferriss
F
Fortinet All Blogs
MongoDB | Blog
MongoDB | Blog
D
Docker

Coralogix

Coralogix | Magic Quadrant 2025 How Redpin achieved full-stack observability across a £10 billion international payments platform - Coralogix Coralogix vs Sumo Logic: Pricing & Features Coralogix vs New Relic: Comparison Guide (2026) Where did all my Claude Code tokens go?  - Coralogix The AI bill arrived. Now what? - Coralogix The Data Plane Reality: OTel Scales, While Topology UX Lags - Coralogix The Observability Dataset: Architecture That Takes Agents From Junior to Senior - Coralogix Un-observable AI is Un-trustworthy AI - Coralogix Dataspaces and Datasets: A faster, goverened, observability data layer - Coralogix Stop Guessing Why Your Pods Are Crashing Coralogix Raises $200M to Scale the Observability Backbone for the Age of AI DataPrime at ingest (DPXL): See the impact of any routing decision New Explore: Faster answers, less friction, and a better way to investigate your data Explore for Spans: One View with Infinite Depth What Is Log Monitoring? Pipeline, Pitfalls, and Practices for 2026 What Is APM? A Guide to Application Performance Monitoring What Is an Incident Commander? Role, Skills, and Best Practices Managing OpenTelemetry at Scale: Why OTel Pipelines Need a Control Plane The cost of knowledge Introducing the Coralogix CLI: Headless Observability for Every Agent How the Coralogix CLI Adds Production Intelligence to Any Agent for Any Use Case Real-Time Database Monitoring: Solving Database Latency with Zero-Code eBPF Tracing Coralogix and Atlassian: Full-Stack observability inside the incident workflow - Coralogix How Kotak811 Revolutionized Digital Banking Observability with Coralogix The Security Trifecta: Operationalizing API Protection with AWS, Wallarm, and Coralogix From Vibes to Signals: Observing Your AI Coding Workflow What “AI-Ready Data” actually means for observability teams Code Agents Need Observability DataPrime at Ingest: Fine-Grained TCO Routing with DPXL Agent-First Observability: Dynamic Data, High Cardinality, and the Business Impact Building Audit-Ready Observability for Digital Banking Debug frontend issues with AI: Real user monitoring meets the Coralogix MCP server The End of Manual Instrumentation: Scaling Observability with OTel OBI & Coralogix Evil Token: AI-Enabled Device Code Phishing Campaign Spending More, Seeing Less: How Indexing Limits Capital Markets Visibility Digital Trading: Why “Healthy Systems” Still Lose Trades From Trace to Root Cause: Mastering the new Trace Drilldown Coralogix Earns 196 Badges in G2 Spring 2026 Reports Across 15 Categories Bridging the gap between mobile experience and technical reality Monitor schema health with engine.schema_fields: Structure, Drift, and Volatility AWS GuardDuty Modules Explained: Features, Coverage, and How Customers Benefit with Coralogix The AWS logs you miss during an incident Slack, Teams & Google Chat in Your SIEM: Why Collaboration Audit Logs Matter
Your Team is Using Claude Code. Do You Know What It’s Costing You?
lily.waldorf@coralogix.com · 2026-04-30 · via Coralogix

The first two weeks of Claude Code are exciting. The third week is when you realize you don’t have visibility into what it’s doing or what it’s costing you. 

You would not run a production service without metrics, logs, and dashboards or deploy an API without knowing its latency, error rate, or cost per request. Yet right now, thousands of engineering teams are running Claude Code, an AI agent that makes real code changes, fires tool calls, and accumulates model costs, with no real visibility into what it is doing. Without instrumentation, Claude Code sessions are a black box. 

This isn’t a criticism; it’s  just where we are in the adoption curve. The tooling has not caught up to the speed of adoption. Until now.

Claude Code already emits the data. Coralogix makes it usable.

Claude Code has native OpenTelemetry support built in. Every session automatically generates structured telemetry, including token usage, model-level cost, tool calls, code edits, commits, pull requests, and active processing time. 

What it doesn’t come with is a destination and a dashboard. 

Coralogix integrates directly to Claude Code’s OTLP exporter, so every session streams metrics and logs in real time into your existing observability pipeline. That includes cost metrics, token breakdowns by type, code impact signals such as lines added and commits, and session-level activity tied to individual users and workflows.

Instead of isolated sessions, you get a unified view across your entire engineering organization. You move from raw telemetry to actual answers like who is driving cost, which models are being used, what code was produced, and whether that spend translated into meaningful output.

This is not another tool layered on top. It extends your existing observability stack to include AI coding agents as first-class infrastructure, using the same OpenTelemetry pipeline, the same querying tools, and the same workflows your teams already rely on.
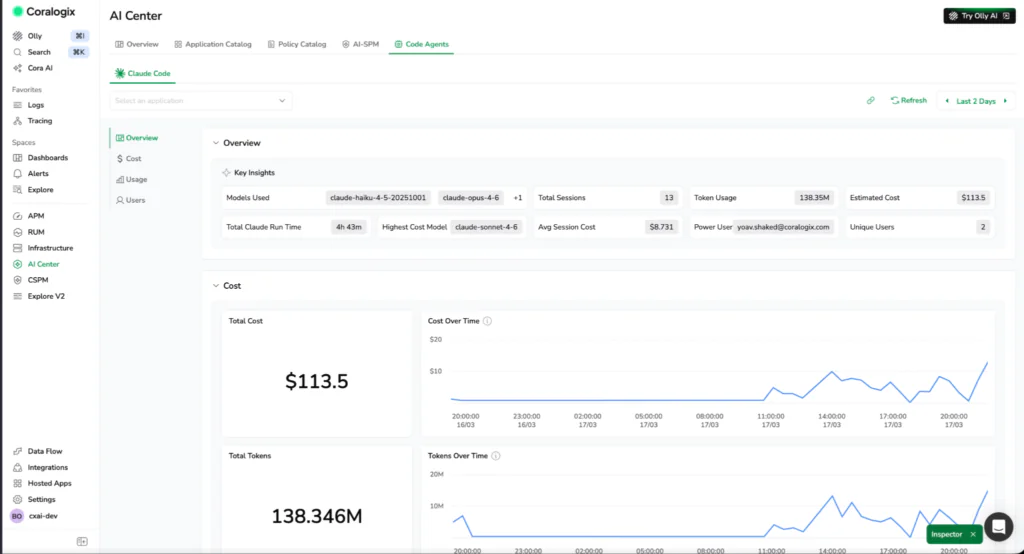
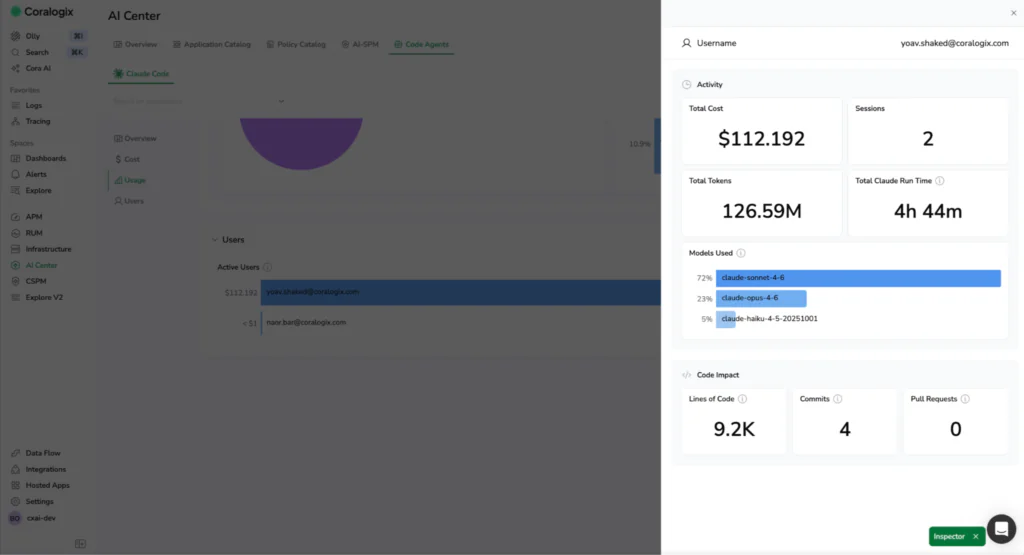
Three signals that change how you think about AI coding costs

Once that telemetry is in place, patterns emerge quickly, especially around where cost is coming from and what you are getting in return.

Token usage and model costs

Get visibility into token consumption and estimated cost across models, sessions, and users.

Usage is broken down by token type, including input, output, cache reads, and cache writes, so you can see exactly what is driving spend and where inefficiencies start to appear. If a team is generating large outputs but accepting very few edits, that ratio tells a story worth investigating.

Code impact vs. compute consumed

Correlate spend with code impact such as lines added, commits, and pull requests. Measure efficiency across teams and workflows and understand whether usage is producing meaningful results.

Token spend on its own is an incomplete signal. What matters is what you got for it; cost only matters in relation to output. Answer the question that actually matters: are we getting proportional code output for what we’re spending?

Active time breakdown

Separate active processing time from user interaction time. You can see how long Claude Code is actively working versus how long developers are reviewing, editing, or waiting.

This distinction helps identify real bottlenecks. Some teams are limited by model latency. Others are limited by human review cycles. Without this split, both look the same. 

What this looks like in practice

A few weeks after rolling out Claude Code, a platform lead gets pulled into a familiar conversation.

Finance is asking why AI costs spiked. Engineering says usage is up, but no one can explain what is actually driving the increase. Some teams claim they are moving faster and others are unsure if it is helping at all. After integrating with Coralogix, the picture changes within hours.

Now, they can see: 

  • Identify which users and teams are driving the highest AI spend
  • Understand which models are contributing most to overall cost
  • Detect inefficient usage patterns, such as high output with low acceptance rates
  • Compare teams to see who is generating consistent output with lower spend
  • Shift from reacting to monthly bills to acting on real-time usage data
  • Optimize model usage and share best practices across teams
  • Set clear expectations for efficient AI workflows
  • Make cost predictable and usage intentional

What was previously invisible becomes something they can measure and control. Instead of reacting to a bill, they can act on the data. They adjust model usage, share best practices across teams, and set expectations around efficient workflows. Over time, cost becomes predictable, and usage becomes intentional. 

The instrument panel you should have had from day one

AI coding agents are infrastructure now. They consume compute, they make changes to your codebase, and they have real costs that scale with usage. Treating them differently from the rest of your observable stack is exactly how you end up in a reactive conversation with finance instead of a proactive one with your engineering teams.

The Coralogix integration with Claude Code makes observability the default, not the afterthought. Token costs land next to your application metrics. Code impact is correlated with compute spend. Every session is traceable, every team is accountable, and the bill at the end of the month stops being a surprise.

You would not run production systems without observability. There is no reason to run AI coding agents without it.

Learn more about Code Agent Observability.

Read the docs