Kubernetes usage on public cloud continues to grow and deliver benefits across many organizations, especially driven by innovation in managed service offerings by the public cloud providers. However, being a specialized virtualization technology does lead to several unique FinOps challenges related to financial accountability and eliminating waste.
With this in mind, we are excited to announce Container Insights 2.0, a set of important enhancements to IBM Cloudability that represent an evolution in container cost management.
Now a widely adopted discipline, FinOps emerged to bring financial governance to the variable, consumption-based spend model of public cloud. By holding teams financially accountable it became possible to take advantage of provisioning flexibility while mitigating the risk of uncontrolled costs.
At the heart of this is taking consolidated billing data, programmatically mapping each cost item – typically representing the cost of a resource per hour – to internal teams, and then making this information visible to everyone. So, what unique challenges does Kubernetes and containerization bring to this process?
Kubernetes clusters are each their own cloud implementing their own virtualization, making you responsible for several additional concerns. Instead of regular IaaS/PaaS where you are dealing with resources like individual VMs and databases, which are typically single tenant, you must deal with multi-tenant environments which aren’t represented natively in the billing data.
| Regular IaaS/PaaS | Kubernetes | |
|---|---|---|
| Virtualization Layer | Hardware | Operating System |
| Infrastructure Responsibility | Public Cloud Vendors | You |
| Resource Ownership | Single Tenant | Multi-Tenant |
| Billing Source | Vendor Exports | Requires work |
| Charging Concept | VMs, Databases, Volumes | Requires work |
The first hurdle to overcome in the context of cost management is determining the cost of each Kubernetes cluster – the cloud you are responsible for – with each one potentially backed by thousands of ephemeral VMs and volumes – resources that are represented in vendor bills.
The next, and far more significant hurdle, is establishing a way to tie consumption of each cluster to your teams and applications, and then associating a cost to this consumption. This necessitates tooling that can reach inside the Kubernetes world and apply complex logic – not something that can be expected of the cloud vendors.
From day one, IBM Cloudability has been focused on bringing financial accountability to all corners of cloud spend. In 2020, this led to Cloudability being the first solution on the market to offer fully integrated container cost management.
An opensource metrics agent can be easily installed across AWS, Azure, GCP or OCI Kubernetes deployments, delivering out-of-the-box cost visibility within the dedicated Container Insights feature and within core analytics. Behind the scenes, the agent maps the resources backing each cluster, pulls the relevant cost data from the billing exports, and then splits these cluster-level costs so they can be allocated back to the tenants.
This splitting was initially done using two cost allocation-friendly constructs: Namespace for “vertical scoping” – comparable to AWS accounts and Azure subscriptions – and Labels for “horizontal scoping” – comparable to resource tags. The most obvious means of doing these splitting calculations was based on how much CPU and memory each container consumed. But there is no official “rate card” for CPU and memory or natural means to weigh them against each other since these are just resources within each VM.
IBM Cloudability solved this problem by analyzing how cloud providers set their prices across VM families, and then give each family a specific CPU and memory weighting.
While this provided an accurate cost allocation, we received feedback that it was difficult to understand why a specific Namespace or Label value was allocated a specific amount.
In response, we added “Resource Contribution” cost visibility to Container Insights.
Now, we’re bringing a new level of visibility with IBM Cloudability’s Container Insights 2.0 by introducing:
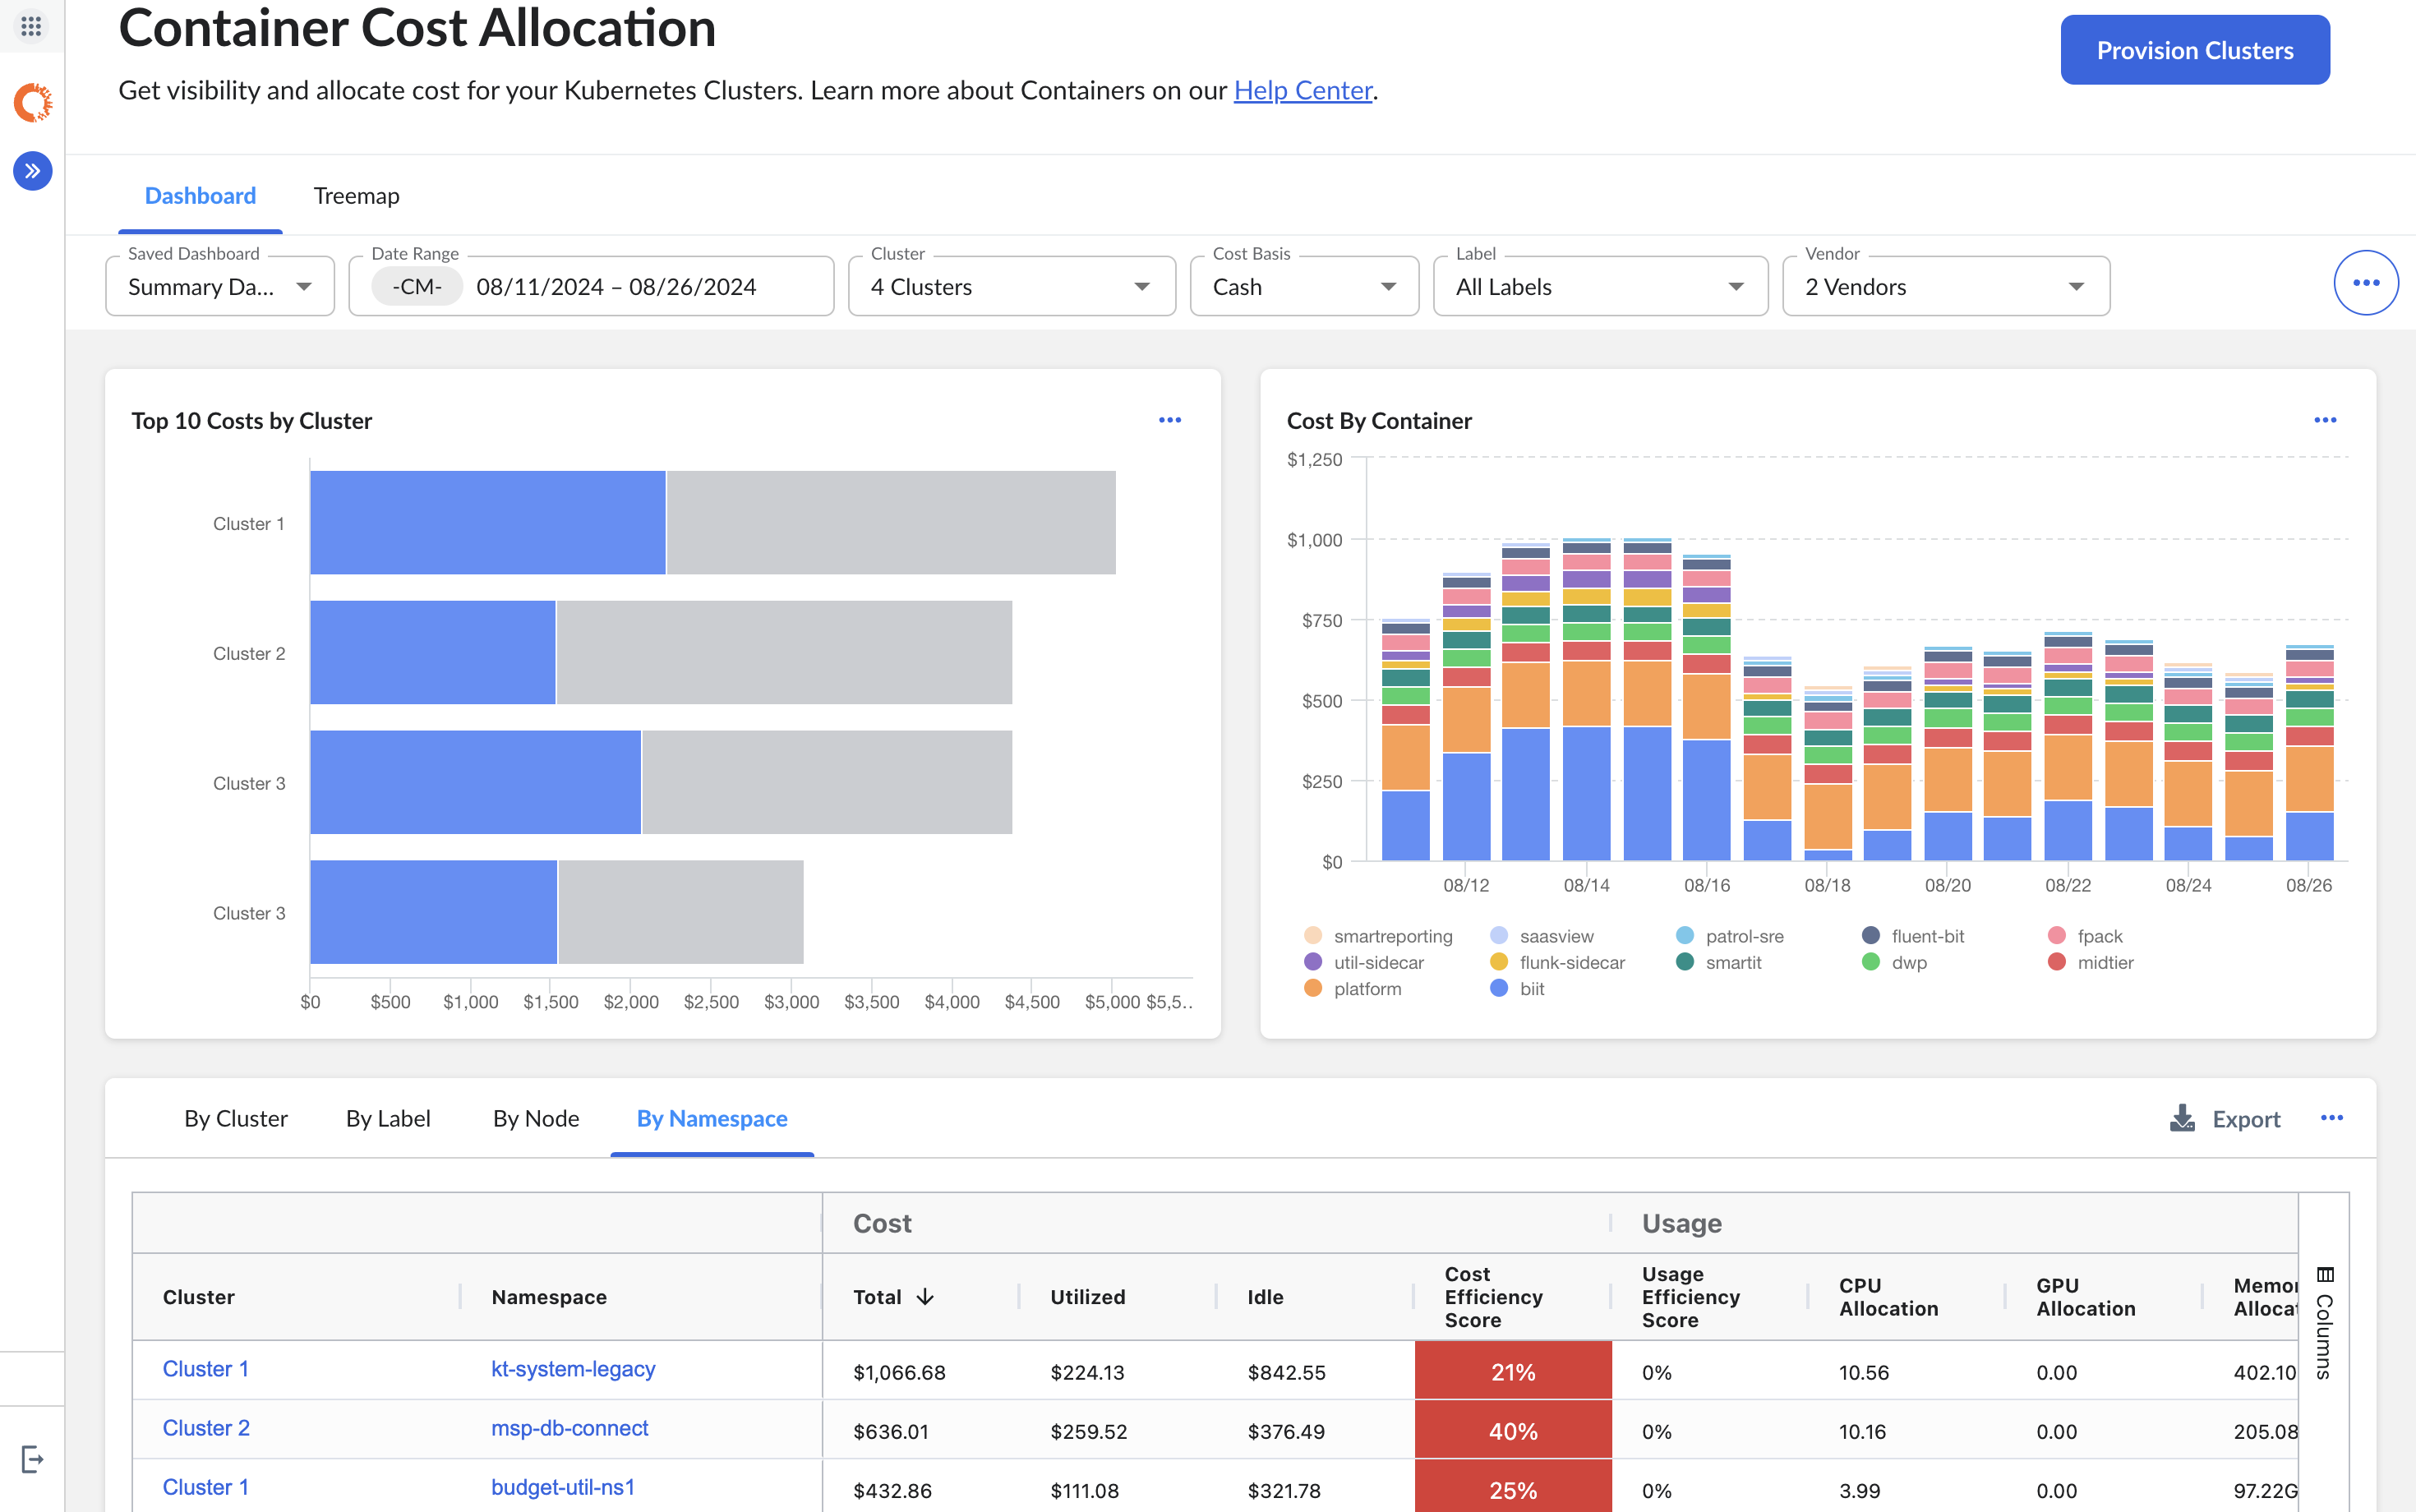
Now you can create your own dashboards within the Container Insights feature. Every user starts with their own default dashboard, providing some great example KPIs and charts. We encourage all our users to create their own dashboards, choosing from different widget types and zeroing in on the data most relevant to them.
All dashboards are supported by the main pivot table at the bottom, providing an entry point for deeper exploration and our new treemap functionality.
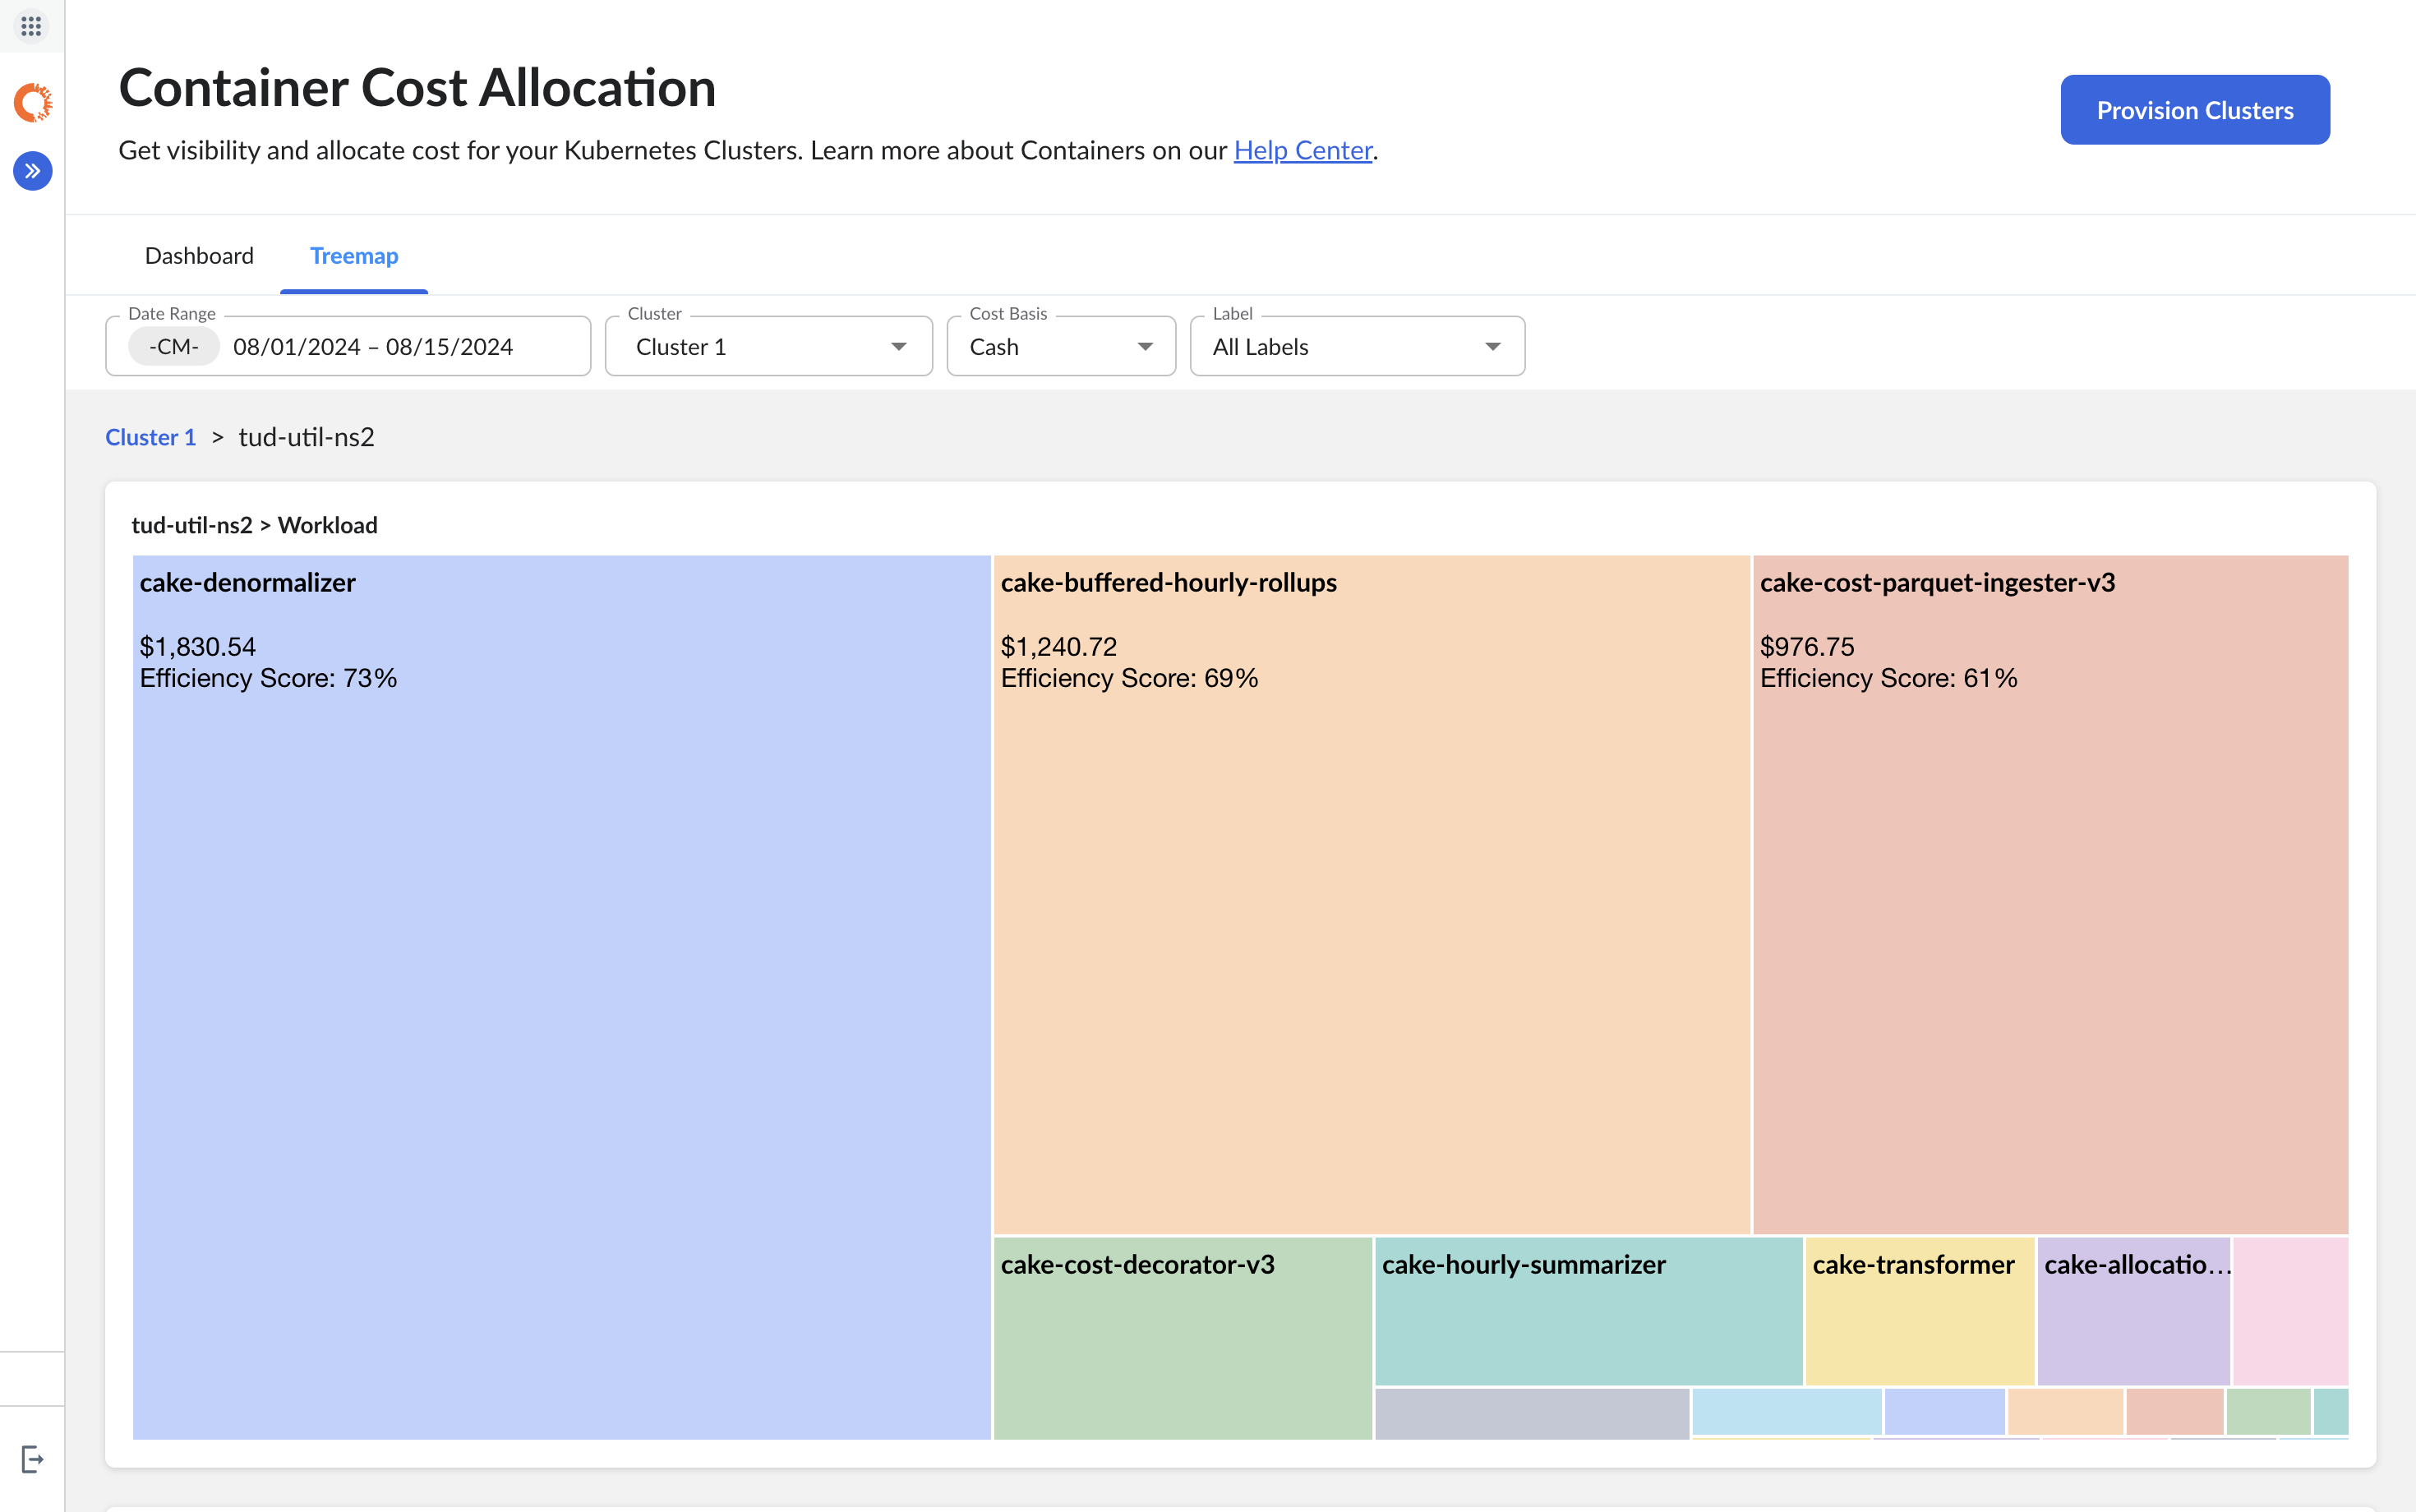
Users can navigate to our new treemap functionality, either contextually through the main pivot table or via the dedicated tab at the top. The treemap functionality makes it simple to understand key relationships – such as what Namespaces exist within a cluster, the workloads these are composed of, and what containers make up each workload – and includes full information about the nodes – or VMs in the case of public cloud – that back this infrastructure.
Bringing visibility to underlying Workloads, Containers and Nodes is an important component of the Container Insights 2.0 launch, going beyond the typical allocation constructs of Namespaces and Labels. This will help engineers and FinOps practitioners better understand the makeup of their clusters and simplify optimization analysis.
Throughout Container Insights 2.0 there are two new metrics that can be used at all layers (e.g., at Cluster, Namespace, or Node level) to quickly indicate efficiency and guide optimization actions.
With Kubernetes usage growing by the day, it’s never been more important for FinOps teams to have the tools and processes that enable them to understand this spend at a granular level and know exactly where waste is accumulating. Pairing this visibility with cloud unit economics takes it further—connecting container costs to business outcomes like cost-per-transaction or cost-per-customer. Stay tuned as the IBM Cloudability team continues to innovate in this space, helping customers tackle their Kubernetes goals.
Not already a customer? Sign up for a free trial today to see how we can help you.
此内容由惯性聚合(RSS阅读器)自动聚合整理,仅供阅读参考。 原文来自 — 版权归原作者所有。