









Afternoon all,
How much mileage can we drag out of a non-event? Not satisfied with a sleepless night for our overnight report we are continuing to bring you top-notch analysis of the ‘nothing to see here’ Spring Forecast.
If you want even more Forecast chat, listen to my Spring Forecast themed conversation with Giles Wilkes and James Smith, where we also look ahead to the Chancellor’s unusual second Mais lecture. Or search Resolution Foundation wherever you get your podcasts and subscribe to never miss an episode (there’ll be more to come…).
As we are not the first to observe, the timing of the OBR’s Forecast was particularly awkward. For a forecast-only day, it was unhelpful that events had overtaken the projections leaving them pretty much DOA. The impact of war in the Middle East could be enormous – albeit not necessarily permanent (as David Miles noted when he spoke to us on Wednesday).
So, for Top of the charts this week we wanted to cook you up a fresh forecast, capturing the significant chunk of economic news we’ve had since the OBR closed their window. What’s changed since last Friday? And what could that mean for our economic and fiscal outlook?
As ever, have a great weekend,
Ruth
Chief Executive
Resolution Foundation
It feels like only yesterday that we experienced a once in a lifetime energy price shock. At least the recent price rises in oil and gas remain both A) of unknown duration and B) well below the size of the energy shock caused by Russia’s invasion of Ukraine in 2022.
For our first chart, we’ve considered how the most recent uptick in prices might affect the energy price cap, with suppliers already pulling fixed-tariff deals. If the highs we saw on Tuesday continued (a big if) the cap would increase by roughly £500, undoing and-then-some the £117 fall coming in April thanks to Government policy.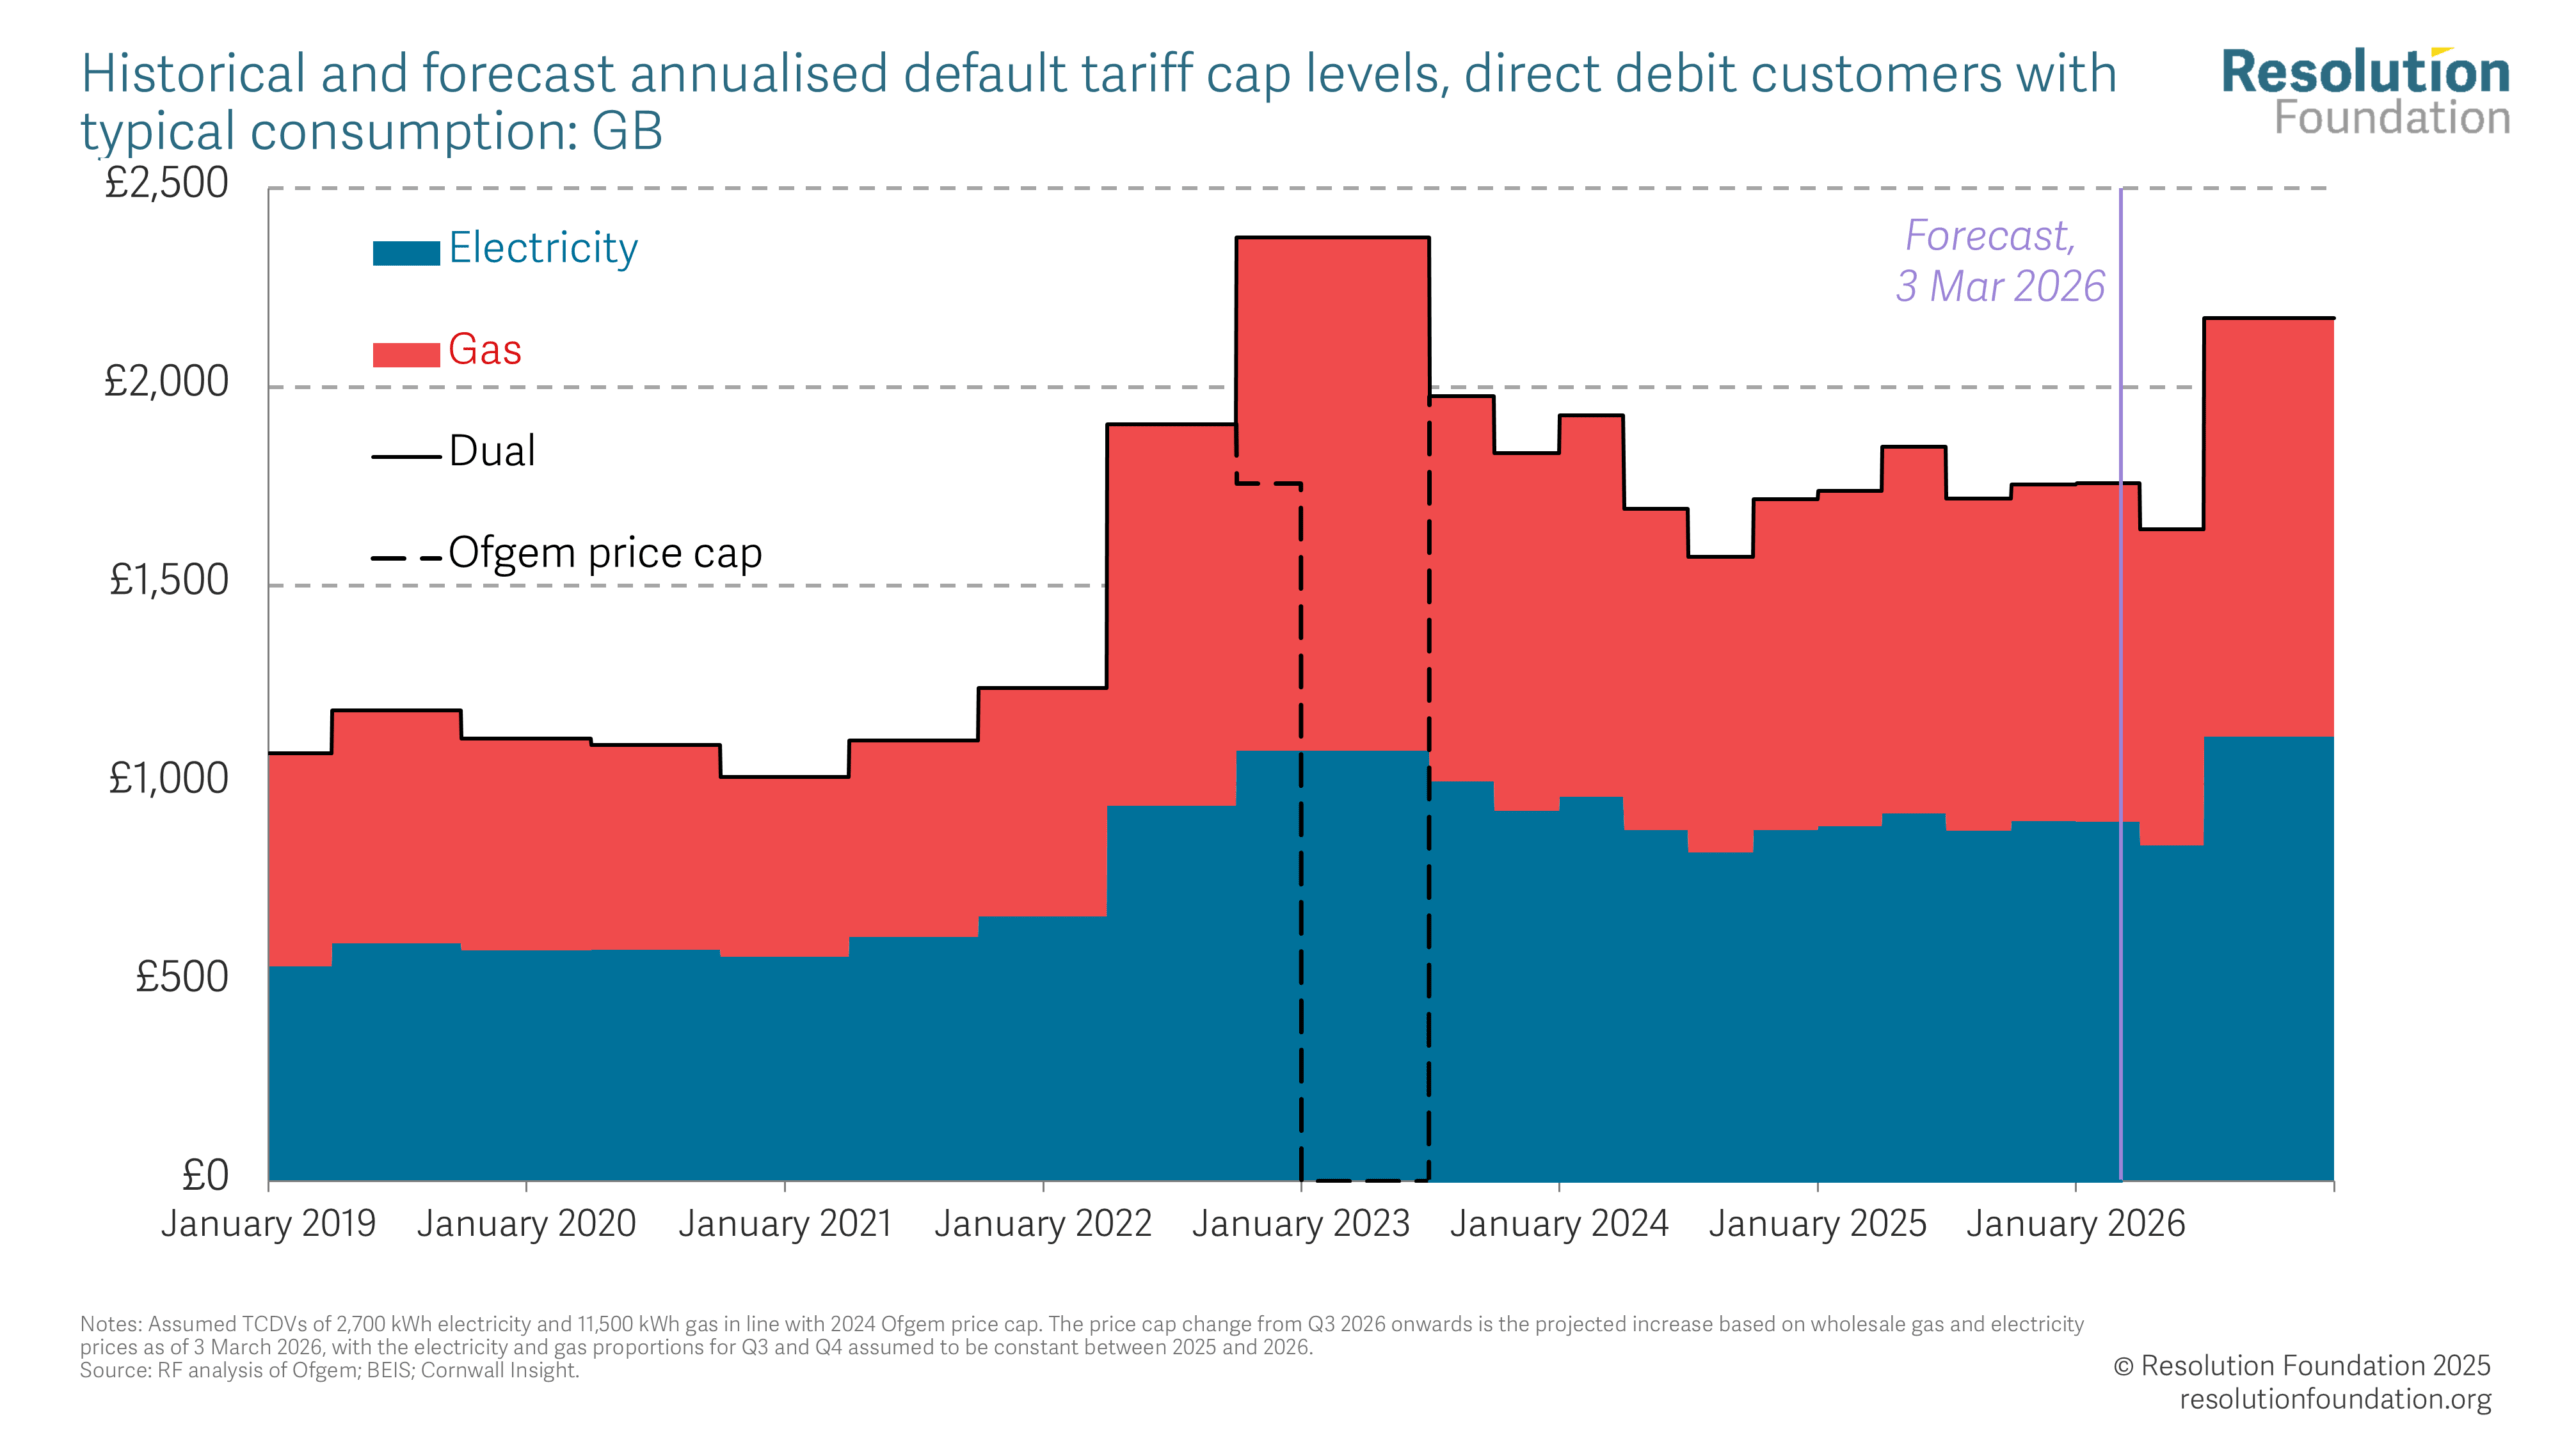
And although the increases in wholesale prices remain much less than those seen after the Russian invasion of Ukraine, the government spent a huge amount to protect consumers from those prices. So while the recent moves don’t bring us back to the price cap level seen in early 2023, they do push it over £2,000. This, combined with the effect of a jump in oil prices since the start of the conflict in the Middle East, would add around 1.6 percentage points to CPI by the summer – just when we thought we’d be back to target!
Heaven knows we’re miserable now
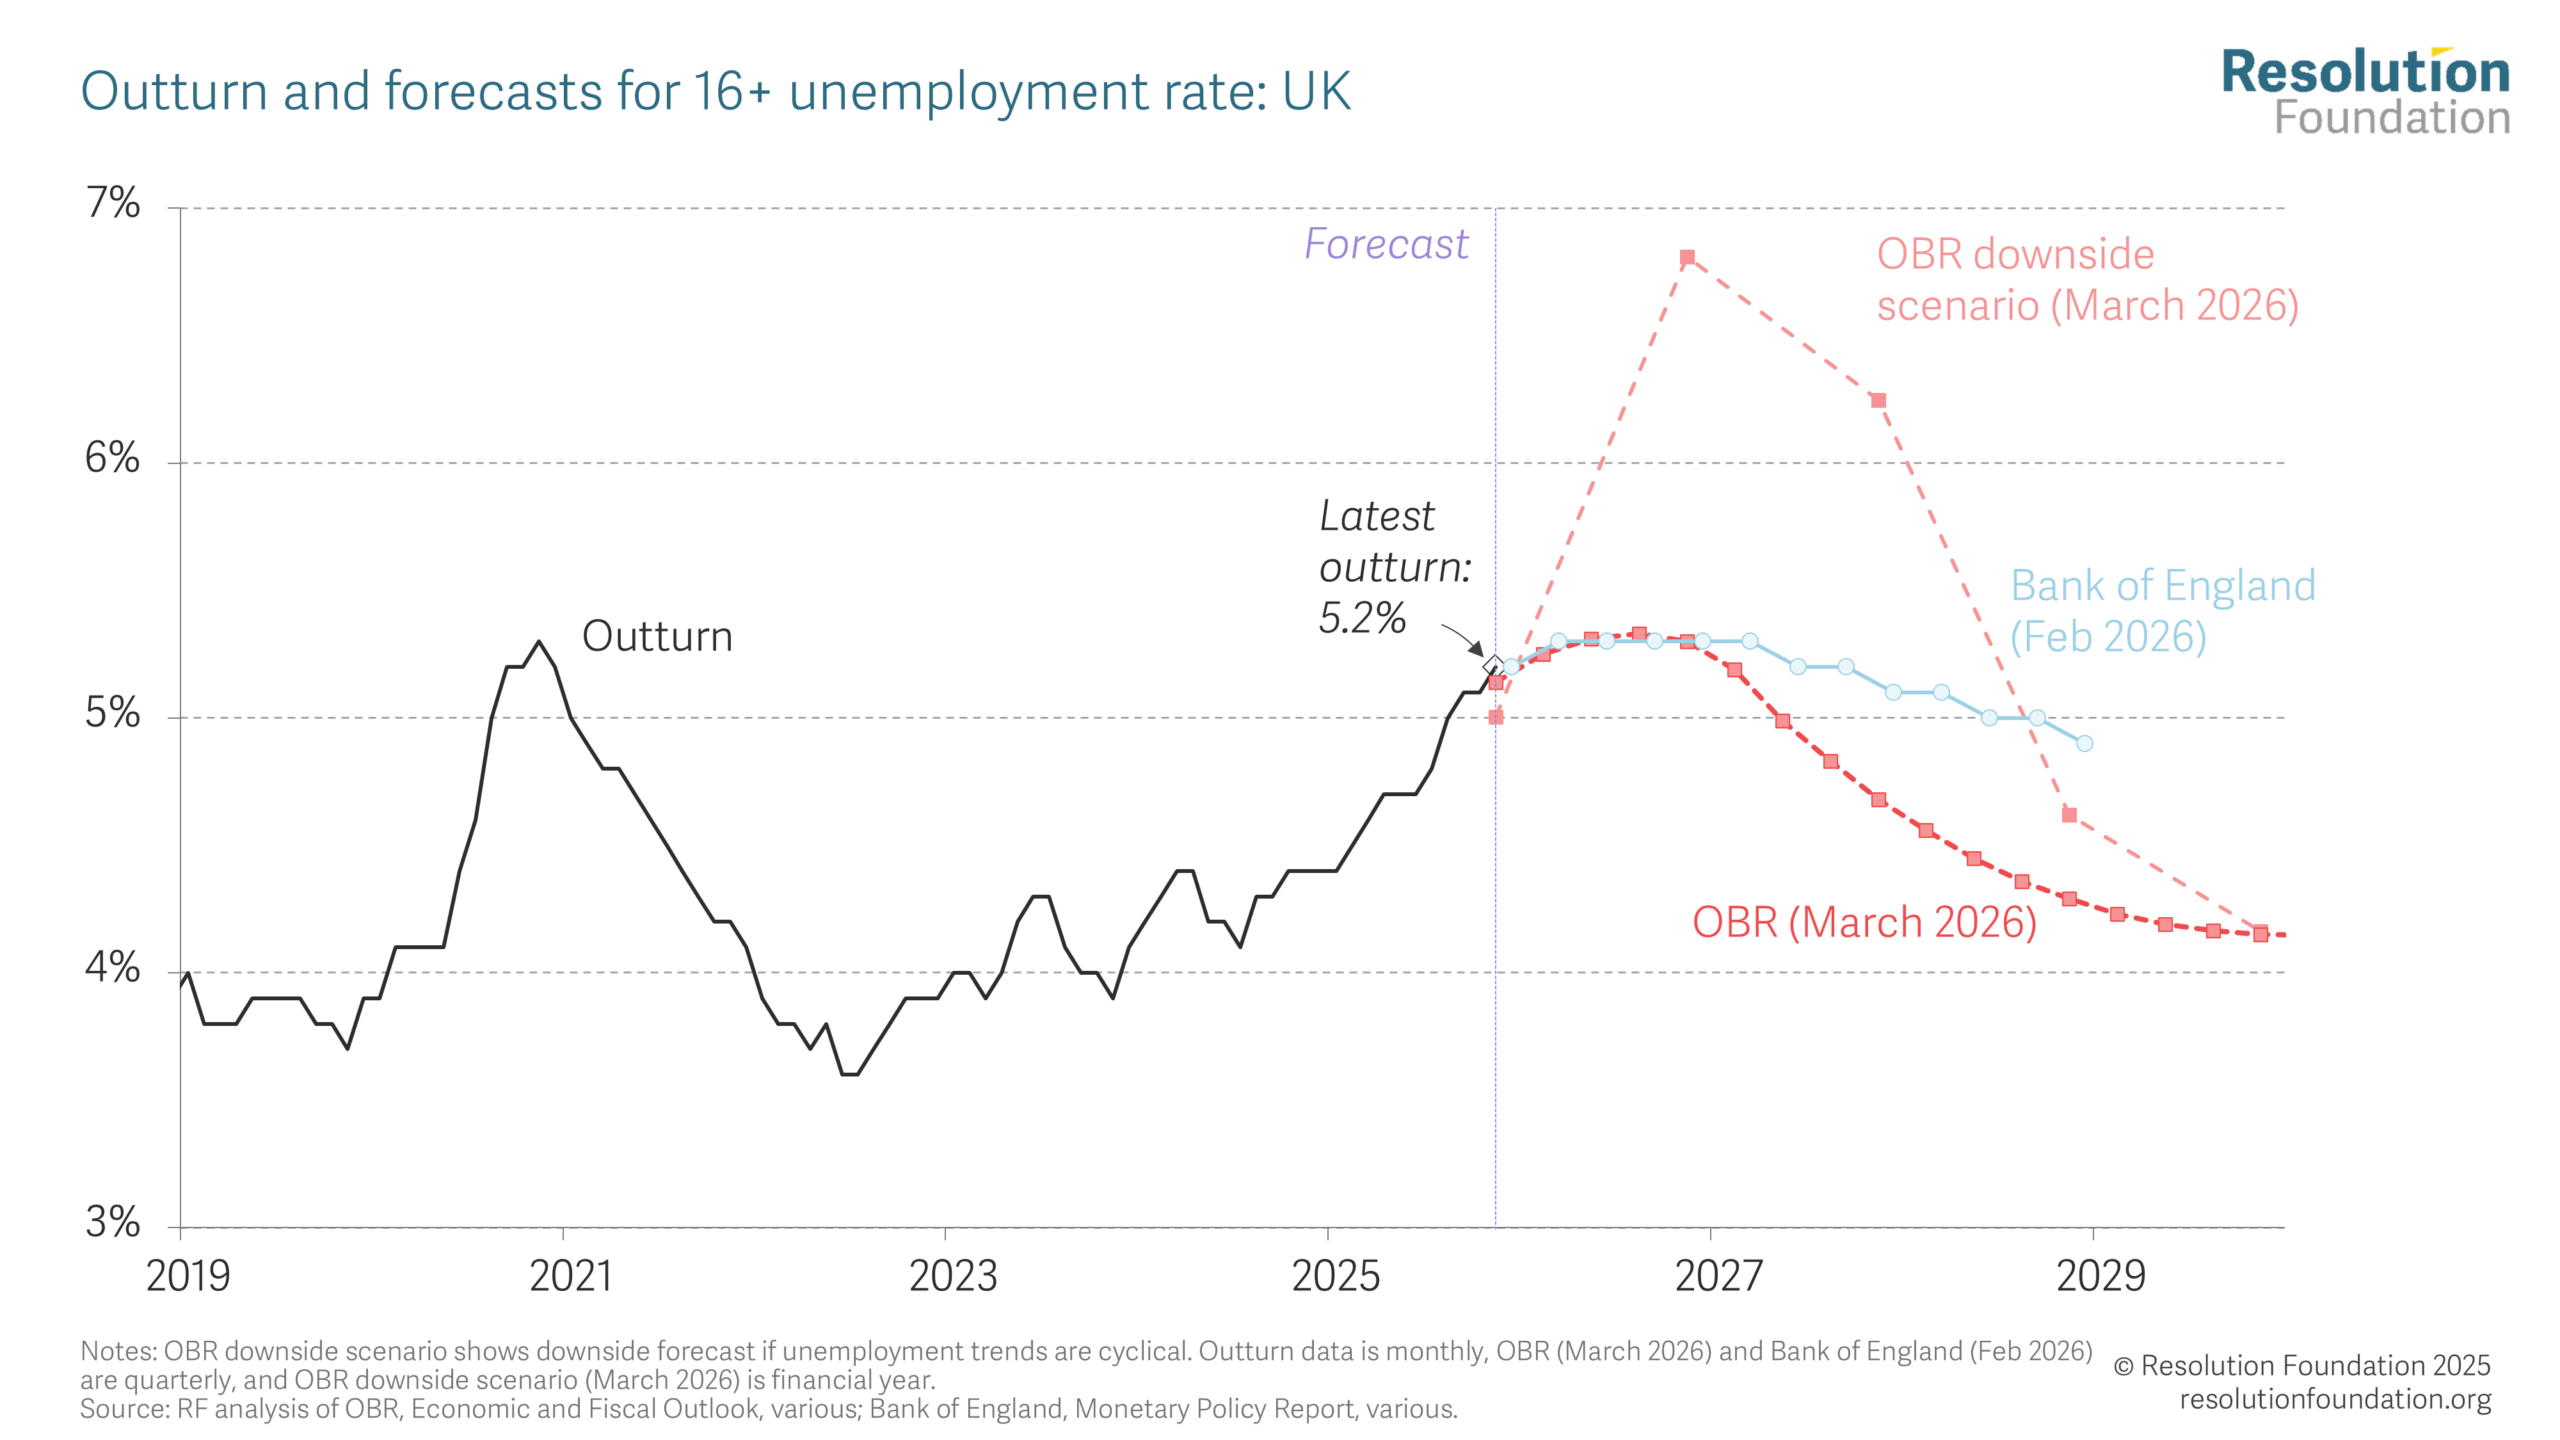
Even before Tuesday’s forecast, we knew there would be a downgrade for the labour market – simply because unemployment reached 5.2 per cent in the last quarter of 2025, exceeding the OBR’s previous forecast of a 5 per cent peak.
The OBR thinks that’s because this is a cyclical weakness due to a lack of demand – the economy is running below capacity by more than they expected. An optimistic take would be that unemployment will fall again because the Bank of England manage the economic cycle. I have unquestioning faith in the MPC. But what could hinder them? Well, for example, an energy price shock from abroad hot on the heels of an earlier one which scarred consumer faith in price stability such that they need to prioritise price level over a weak labour market….
So – what if things get worse before they get better? Luckily, in this instance the OBR came prepared. Their forecast included a scenario for a worse cyclical downturn. As the dashed red line shows, this scenario could bring us close to 7 per cent unemployment by the end of the year – a return to levels last since during the depths of the global financial crisis.
Gilt-y as charged
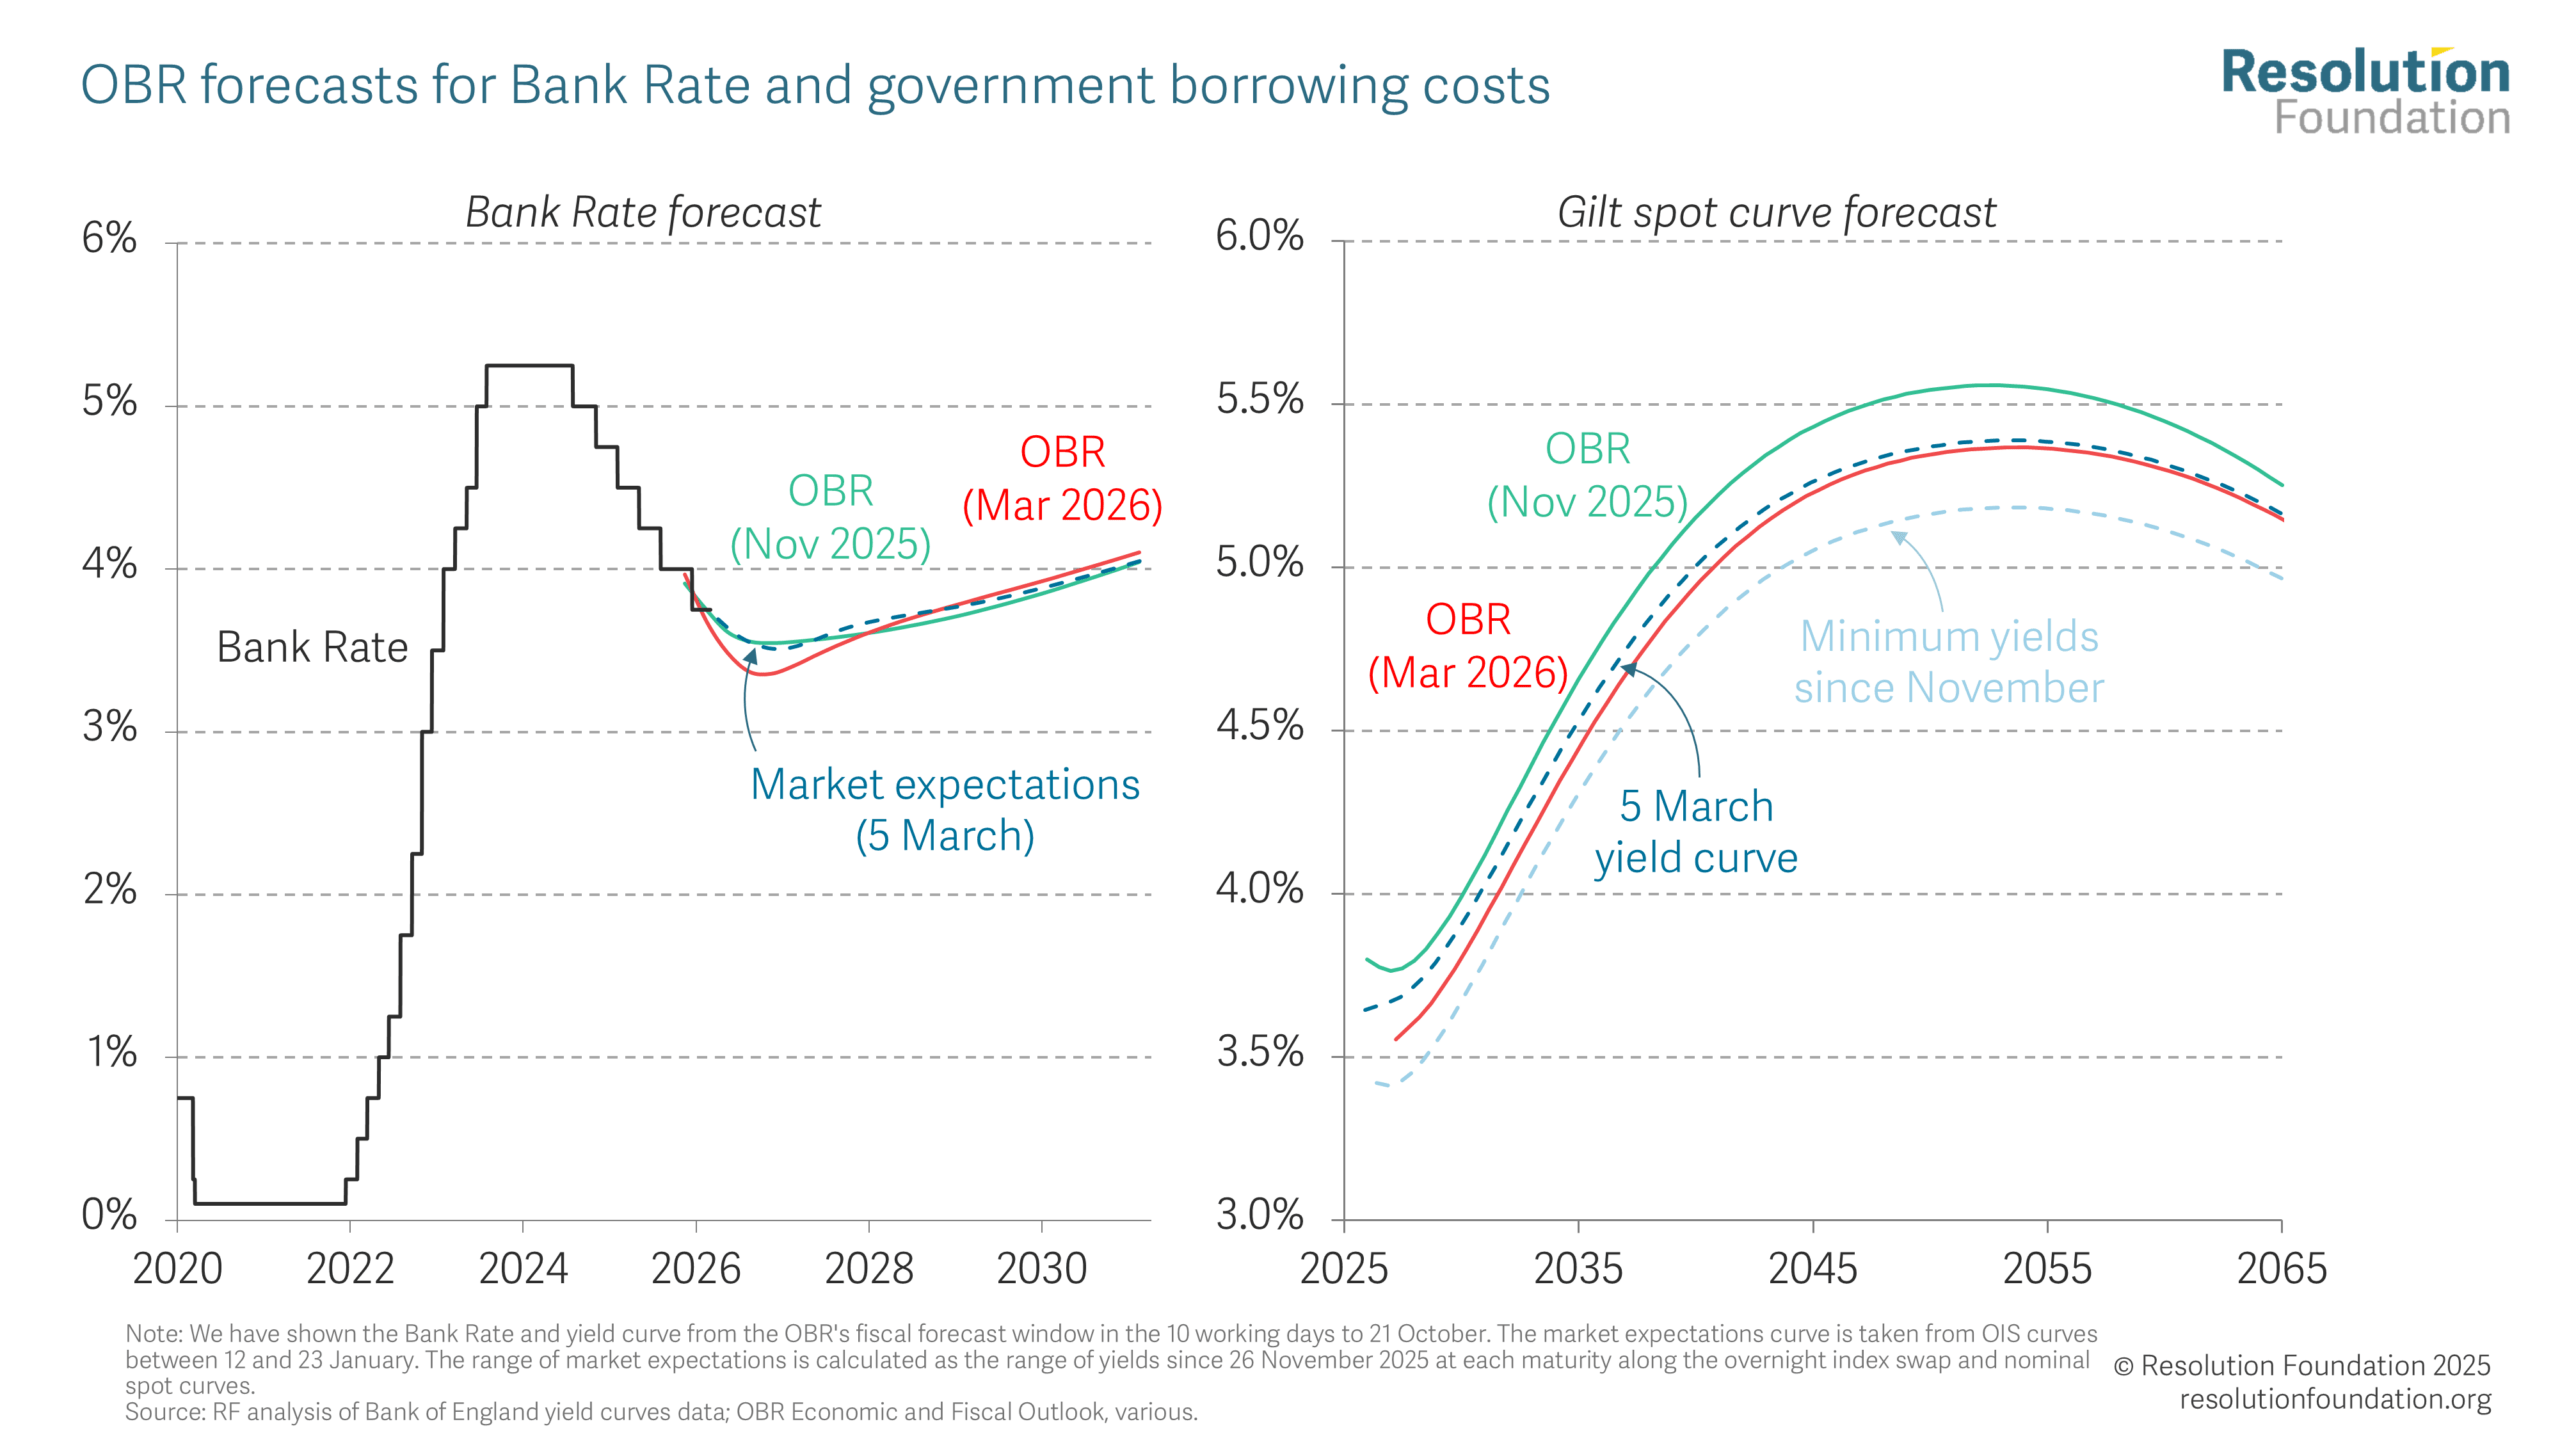
And what about the cost of government borrowing? On Tuesday, this was one of the biggest bits of good news. The future paths of Bank Rate and gilt yields were expected to fall compared with November, lowering borrowing costs and delivering a £2.6bn boost to the public finances in that all important fiscal rule year of 2029-30. Unfortunately, we have been reminded once again this week that the sensitivity of our debt interest bill to yields is a huge source of volatility in the forecast.
On 5th March Bank rate expectations were closer to the November forecast than the March one. Gilt yields hit a low for February last Friday, leaving the OBR forecast potentially too pessimistic, but just a few days later they are already higher than the forecast. The point here is not that these are large moves, especially given the dramatic events in the world, but that our debt interest bill is so sensitive to them that it introduces huge uncertainty into the forecast. It’s anyone’s guess whether this is a plus or a minus by November, but moves over the last few days are on their own bigger than the move between the March and November forecasts. On the plus side, yields are only slightly higher their late-January levels, meaning the Chancellor’s headroom is bruised rather than broken – for now.
Put it together and what have you got?
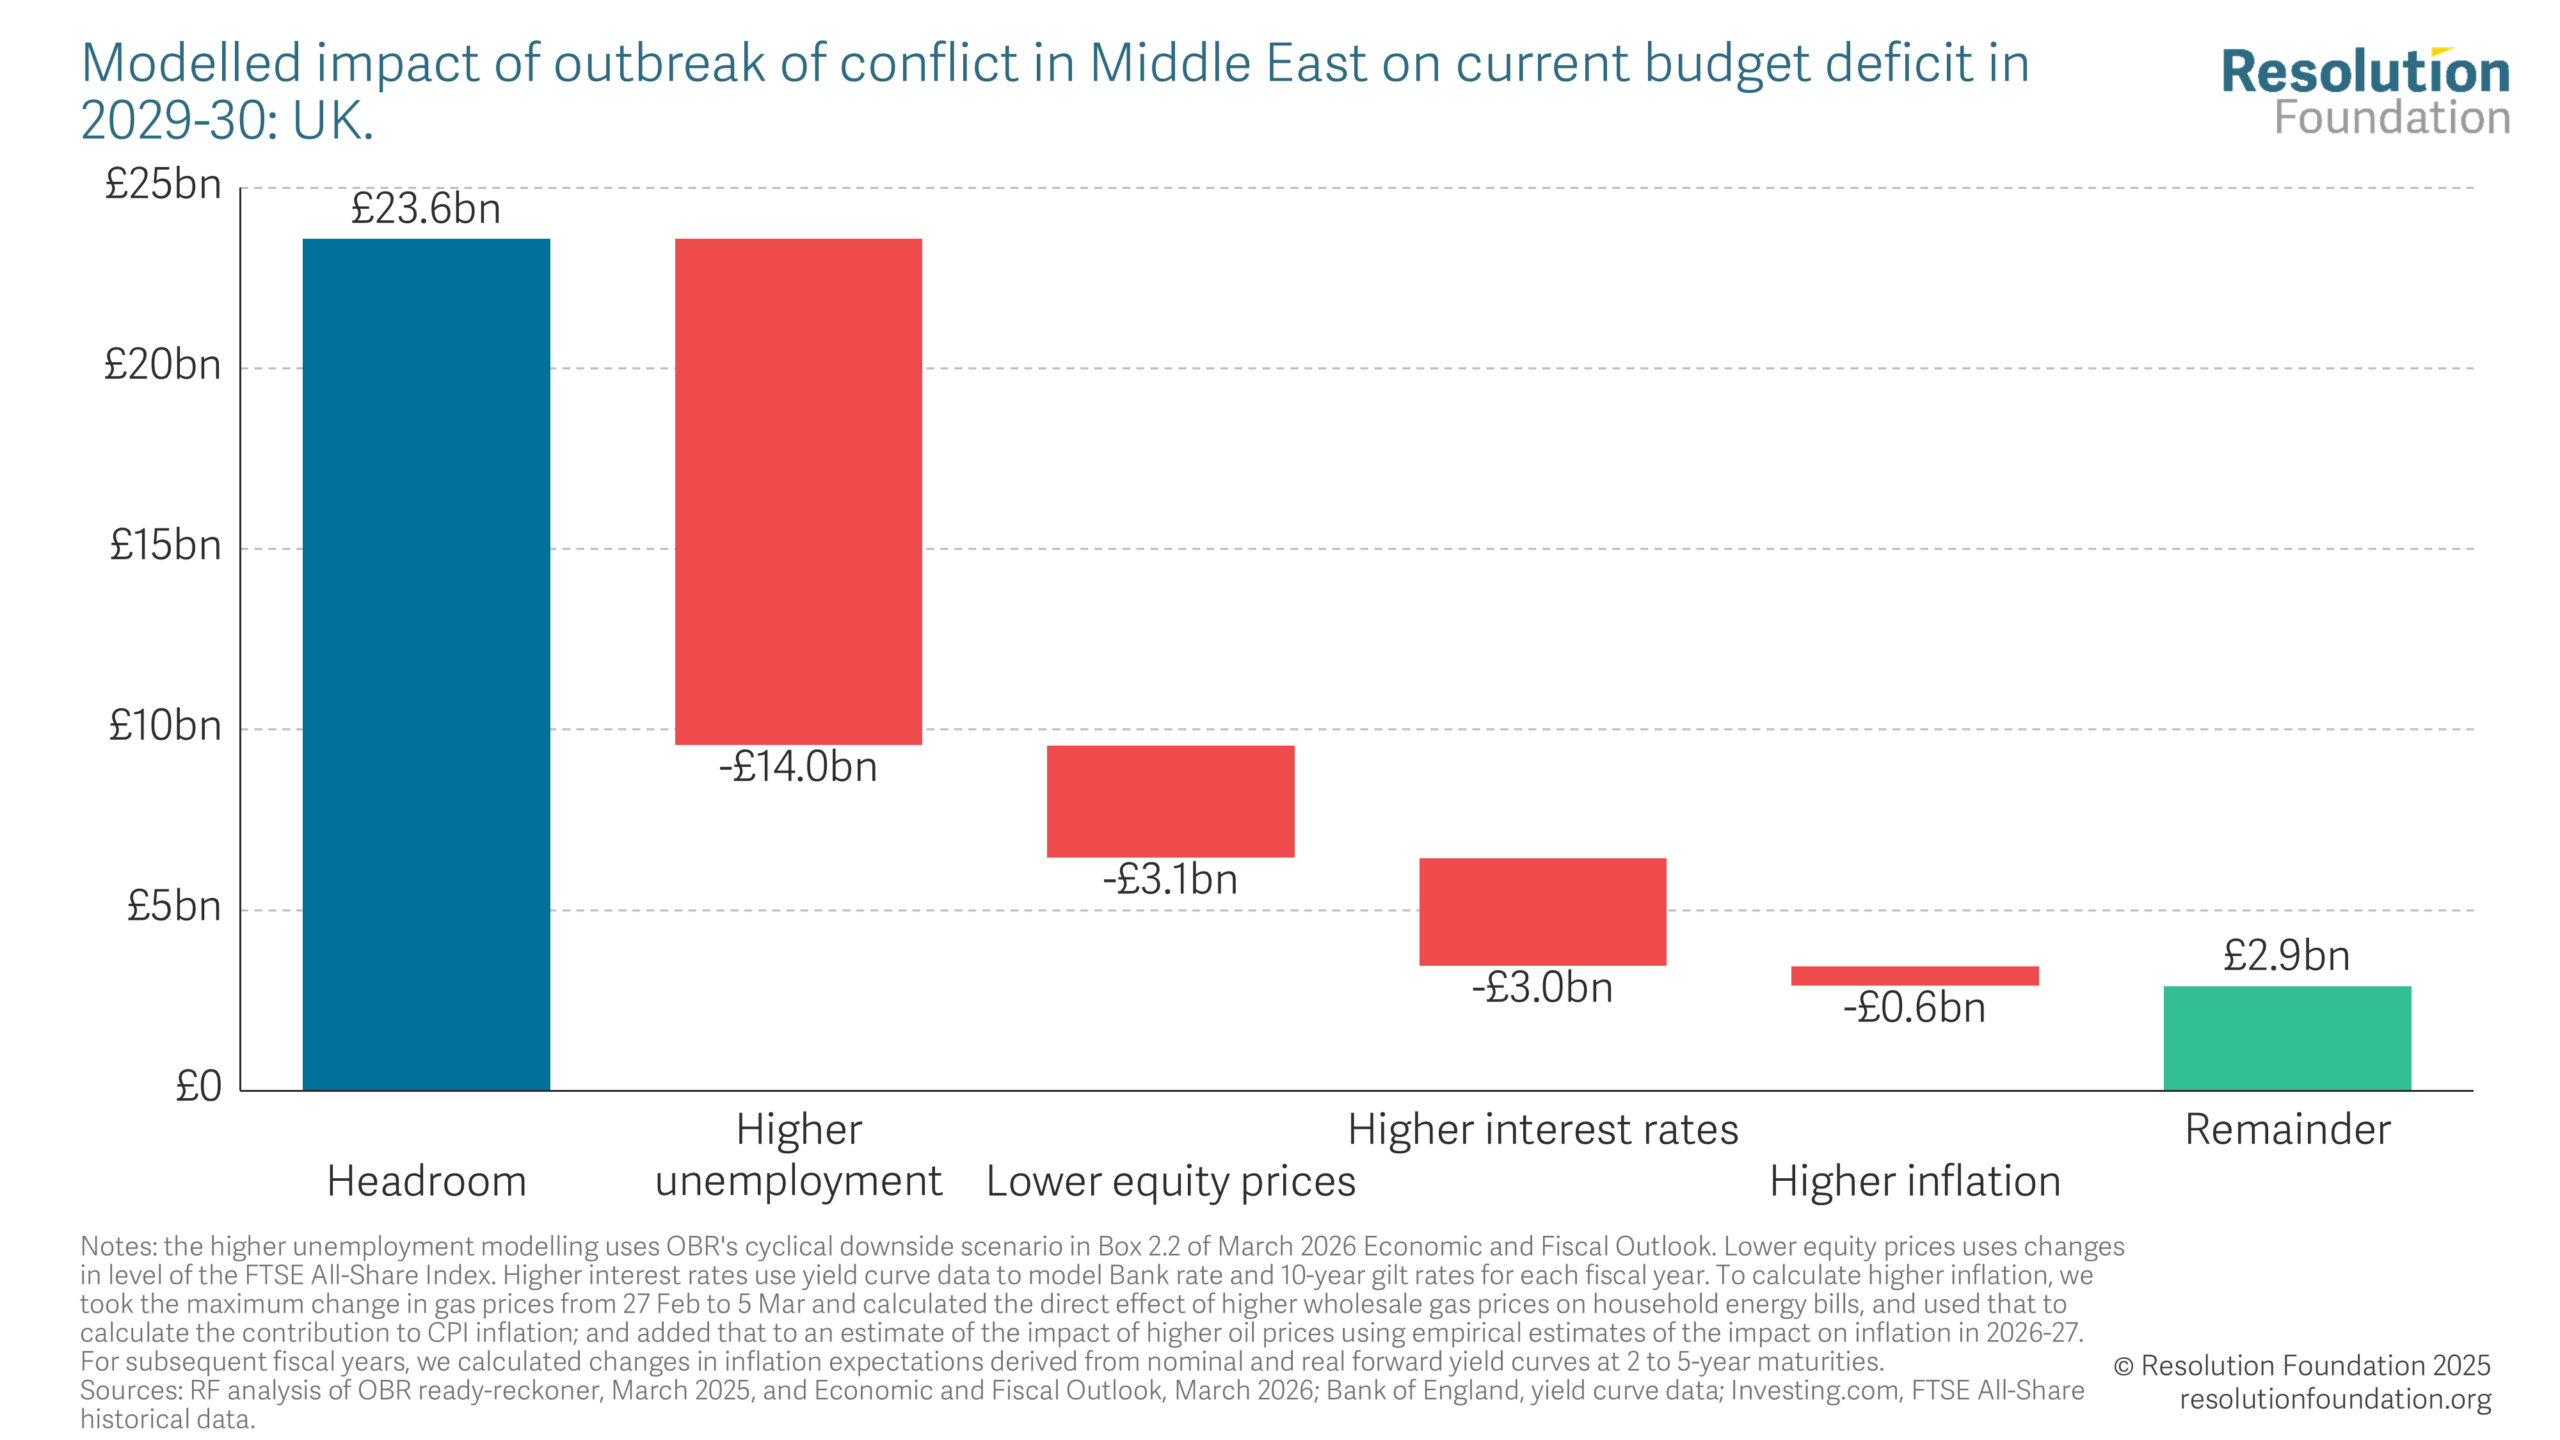
So, this isn’t sounding great – inflation up, unemployment up, cost of borrowing up. What would this all mean for the Chancellor’s precious headroom? We’ve had a go at illustrating this for you: we start on the left with the Chancellor’s respectable £24bn headroom from Tuesday in the blue bar. You can see how quickly it can fade away, especially with some imported inflation.
Now what we haven’t done is produce a new economy forecast in its entirety. Instead, we combine the fiscal downsides of a bigger than expected cyclical downturn in the labour market with the impact of market moves seen between just 27th February and 5th March. To be clear, simply updating the OBR’s forecast to latest market moves today would produce something smaller because prices got better before they got worse. But there’s a long time to go between now and the autumn…
What we’re left with is a whisper thin buffer against the fiscal rules of around £3bn – and that’s before the government takes any action to mitigate the impact of higher unemployment and energy bills.
One step forward, four steps back
Above, we’ve been grappling with global and somewhat abstract forces – but what really matters is how much people have in their pockets at the end of the month. Our final chart sticks with the OBR’s central forecast (so does *not* assume a £500 uptick in energy bills).
On this basis, next year would actually have decent living standards growth (following a dismal year just gone) strongly skewed towards lower-income families. Families in the poorer half of the country would on average be £800 better off next year compared to this year. Unfortunately, it doesn’t look set to last.
From 2027-28 to 2030-31, living standards are predicted to worsen across the entire income distribution, with lower-income families hit the hardest.
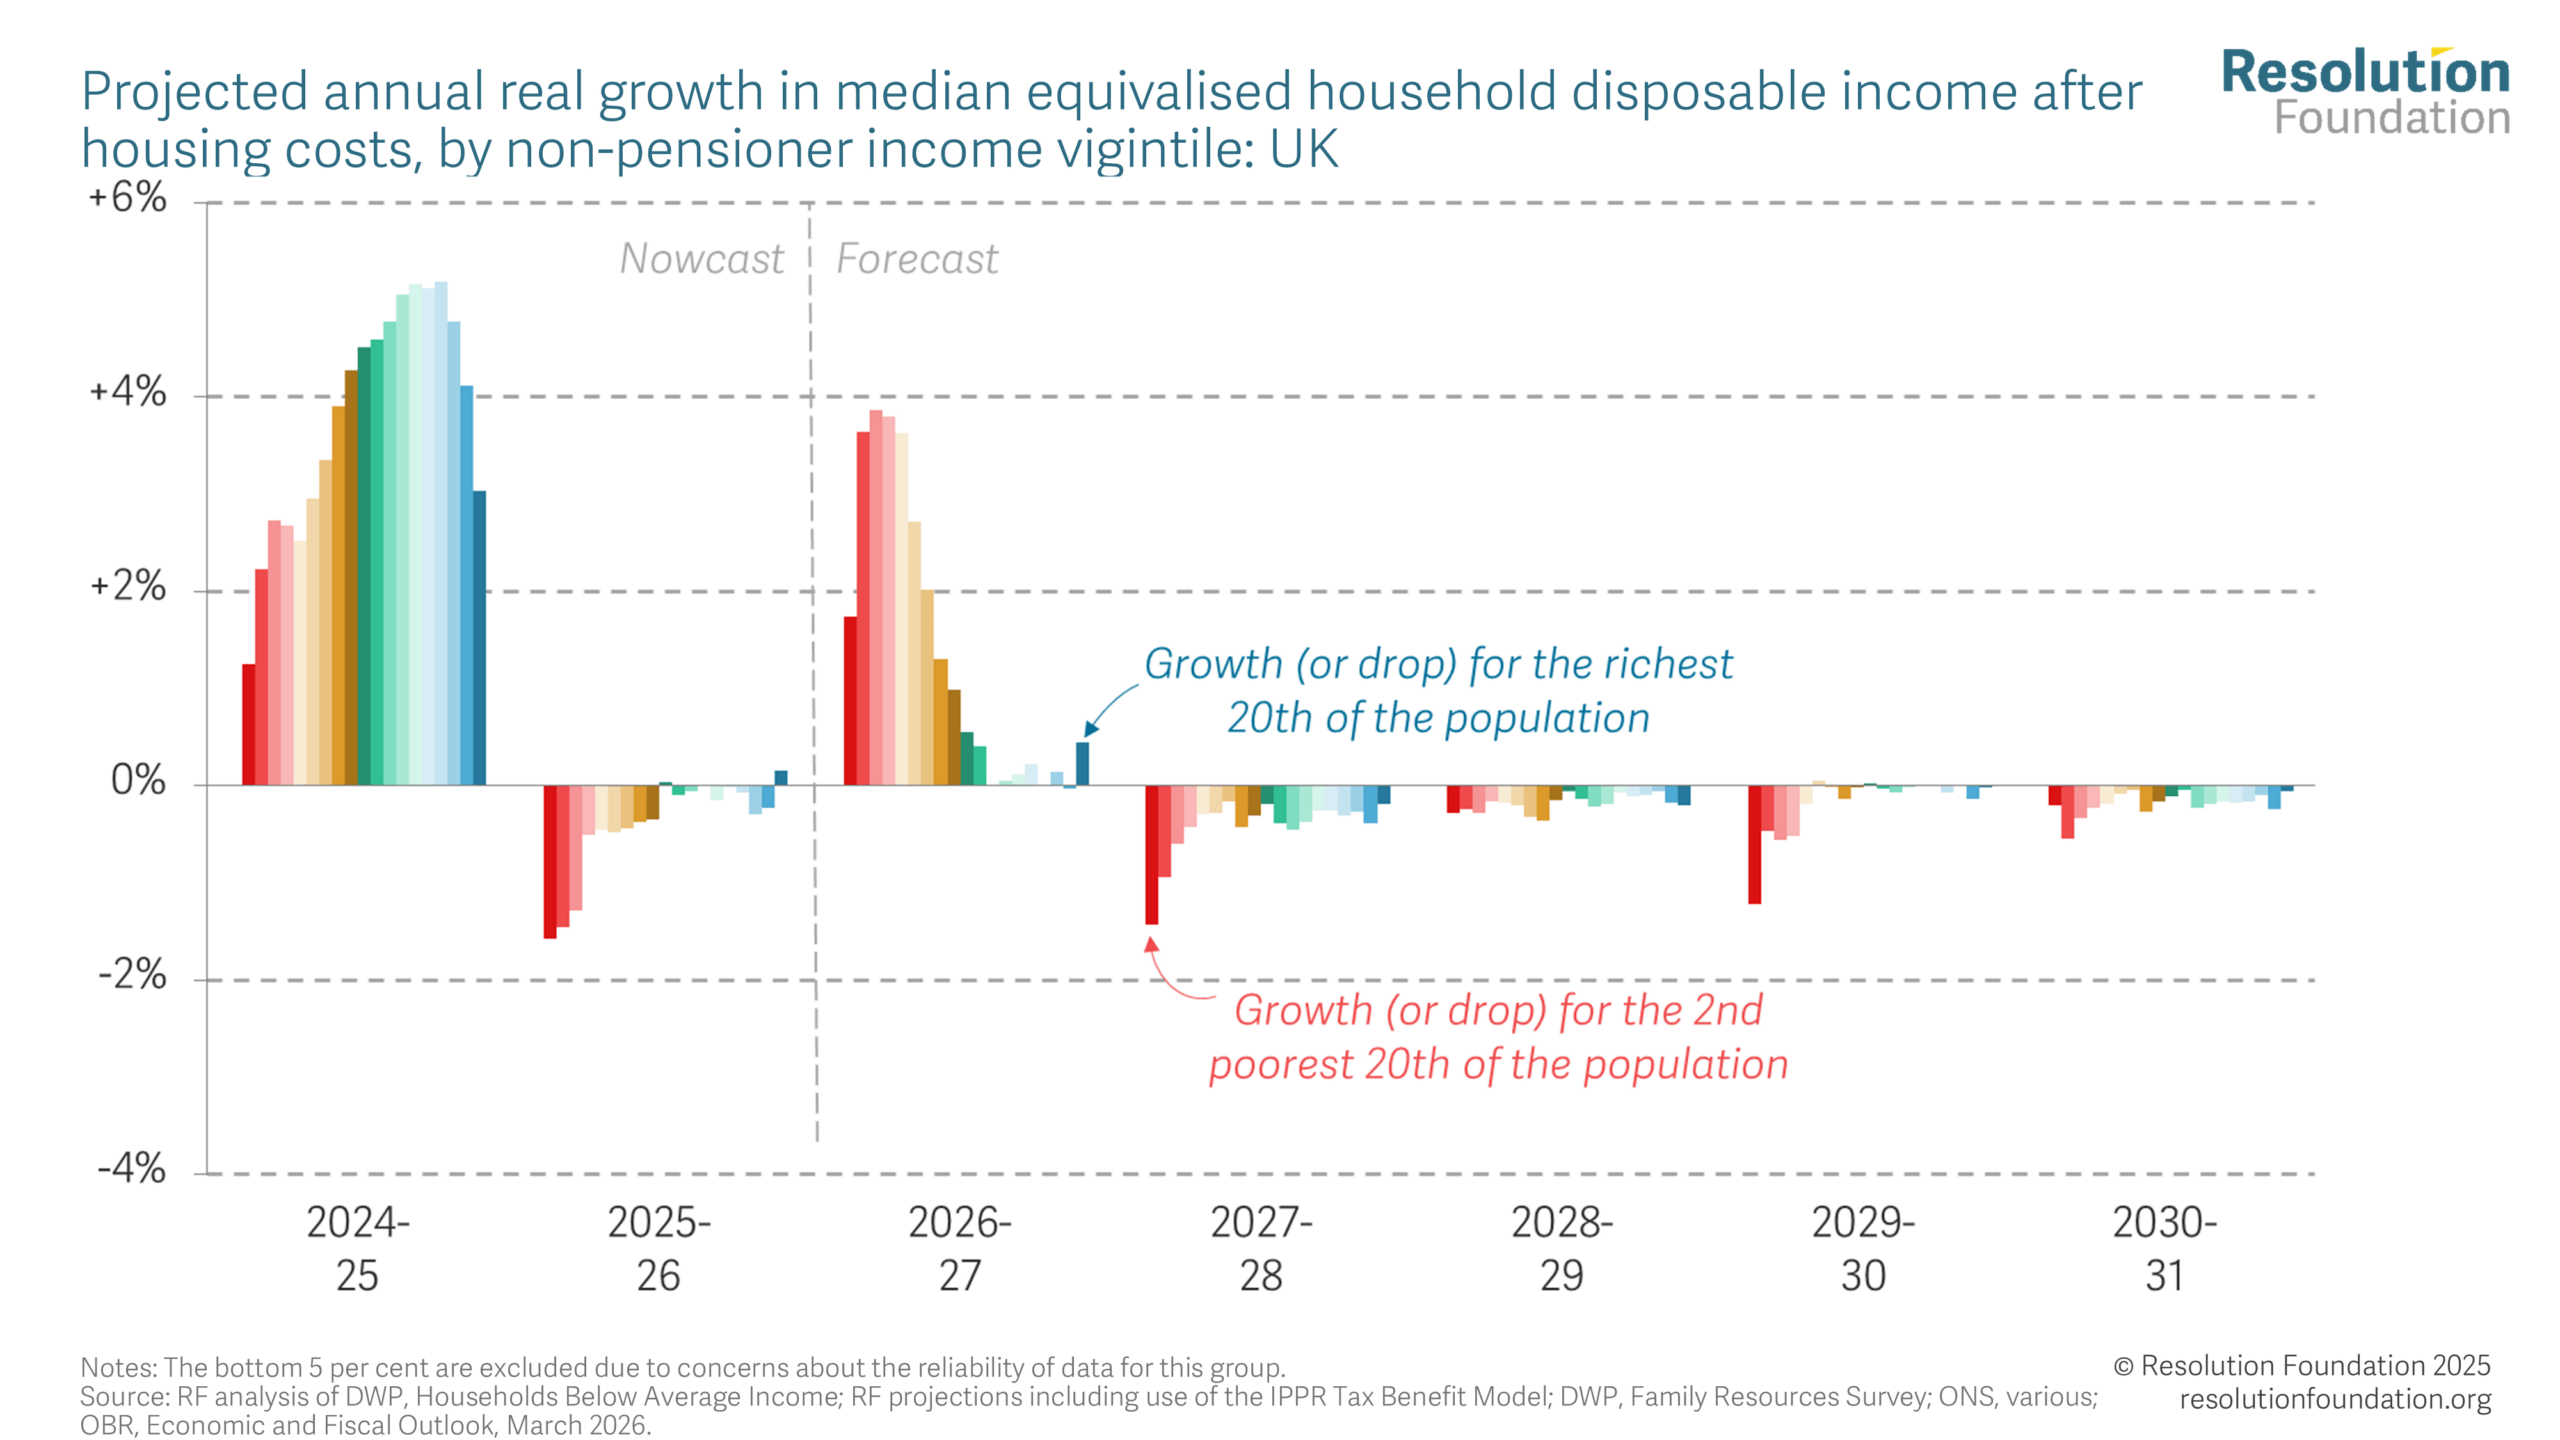
How does this square with the Treasury’s statement that by the next election people will be over £1,000 a year better off? This appears to be based on a comparison of real household disposable income per person in the final full financial year of the previous and current Parliaments. Our own forecasts agree that on that basis people will be £1,000 better off.
But the kicker is that two-thirds of this projected growth *has already happened* (check out that bumper year in 2024-25). The challenge is, it is not obvious that the £790 better-off-since-2023 households have acquired any good will towards this Government. So, with only £390 more to come these forecasts don’t seem ones to shout about.
此内容由惯性聚合(RSS阅读器)自动聚合整理,仅供阅读参考。 原文来自 — 版权归原作者所有。