










Megaport's network visualizations reveal the dynamic interplay of customer connectivity across our Software Defined Network (SDN). Explore how Force Graphs, Edge Graphs, and Hive Plots illustrate the growth of multi-cloud adoption, interconnectivity trends, and network metrics. Discover tools like D3, Gephi, and R to analyze and visualize networks effectively, and learn how Megaport enables seamless, one-click connections to every major cloud provider.
Here at Megaport, we offer customers several layer 2 network services on top of our layer 1 network. The physical network can be thought of as a set of points with connections between them, and is ultimately represented in a database structure something like this (representing a ring network of three locations):  The physical network is (eye-wateringly) expensive and because of that is it relatively static over time. When our customers buy services they are effectively constructing their own virtual networks on top of ours, and this is *much* more dynamic, complex, and well, interesting. A table of data might be completely accurate but it is not very visually appealing, so what to do about that? When I hear ‘network’ I naturally think ‘graph’ and how I can visualise the data…
Graph Theory is an extensive field in mathematics with some surprisingly common applications (the travelling salesman problem is a famous example). It starts out fairly simply - there are simply nodes/vertexes joined by edges. 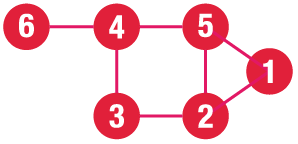 It turns out that there are all kinds of networks, classified by the way they are connected. The following image comes from a research paper.
 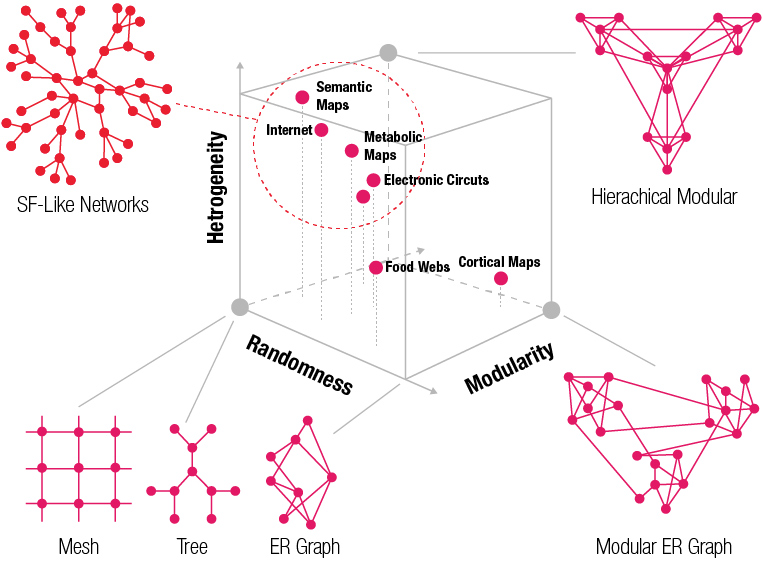 You may have heard of “small world” networks - things like your friend graph on Facebook. In these networks, most people are connected to the people next to them, but a few people are connected to a *lot* of people. In this way you are connected to Kevin Bacon in a surprisingly small number of links. Megaport services map very well onto a graph model - a Port is just a node in the graph, and our connectivity products VXC/CXC and IX are edges joining the nodes. I wonder what kind of graphs we will see in our customers’ networks?
For this blog post I will cover three different kinds of graphs that are meant to visualise networks:
One of the first (and easiest) graphs to make is a Force Graph where we simply draw dots and lines and the graphing engine uses a physics model to make the nodes spread out (you literally apply a ‘charge’ value for each node to make them ‘repel’ each other).
The IX (Internet eXchange) services illustrate the Force Graph nicely - the nature of the IX service means that the graph will be quite simple, and that is in fact what we see. Each exchange has a number of Peers connected. In the Australian market, you can see that a number of customers connect to two or more peering exchanges. 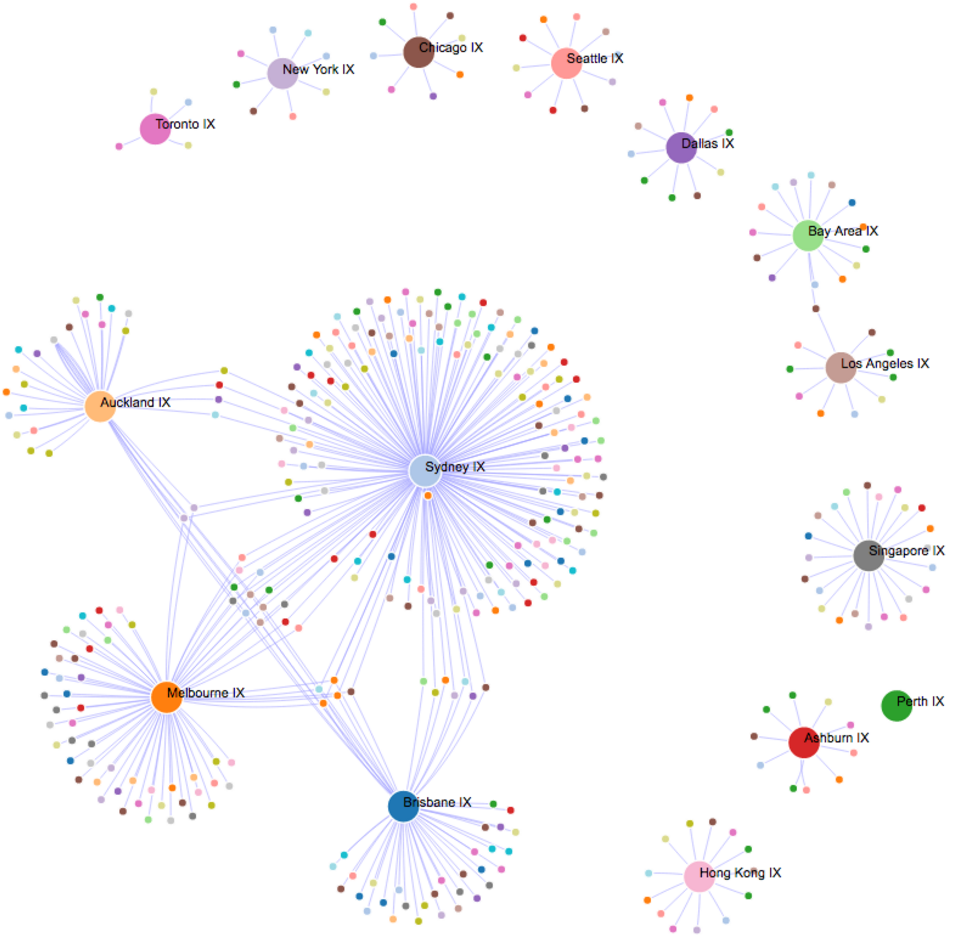
The VXC service is potentially much more complicated / interesting since it is possible to make arbitrary connections to any port on the fabric. Here you can see two predominant types of connections - those to the cloud providers (the centres of the ‘flowers’), and those using VXCs to make their own private network (this isolated ones, twos and threes). 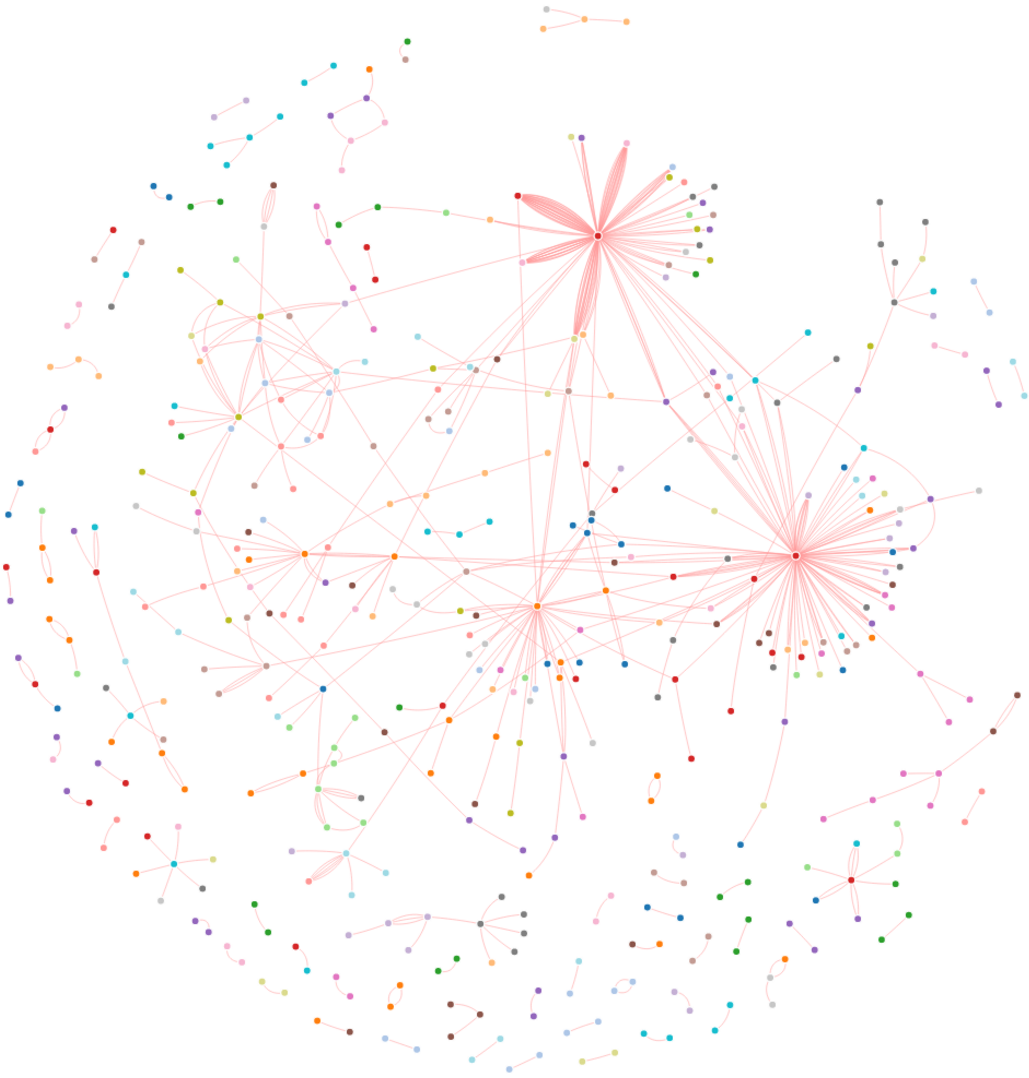 This is pretty much what you might expect in the beginning; what most interesting are the more densely interconnected sections:
 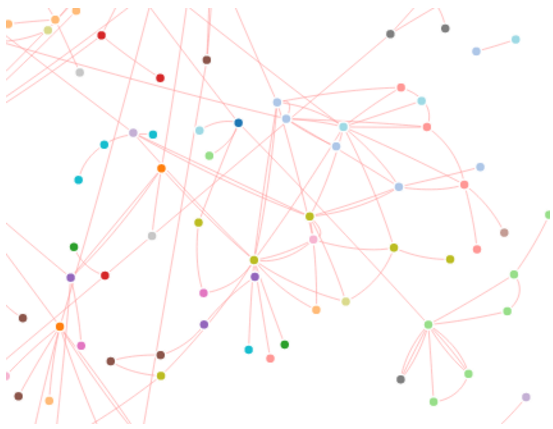 This is the kind of behaviour that I would expect to grow over time, with lots of participants exchanging data with many others. It will be interesting to drill down and find out what industry segments these businesses fall into, and what applications we are supporting for them. We want to encourage this kind of behaviour since the value of the Megaport fabric grows exponentially as this density increases.
In this visualisation, the blue lines are IX connections, and the red lines are VXCs. You can see that many ports have both IX as well as VXC connections, which is starting to look like a pizza, and perhaps not very informative. 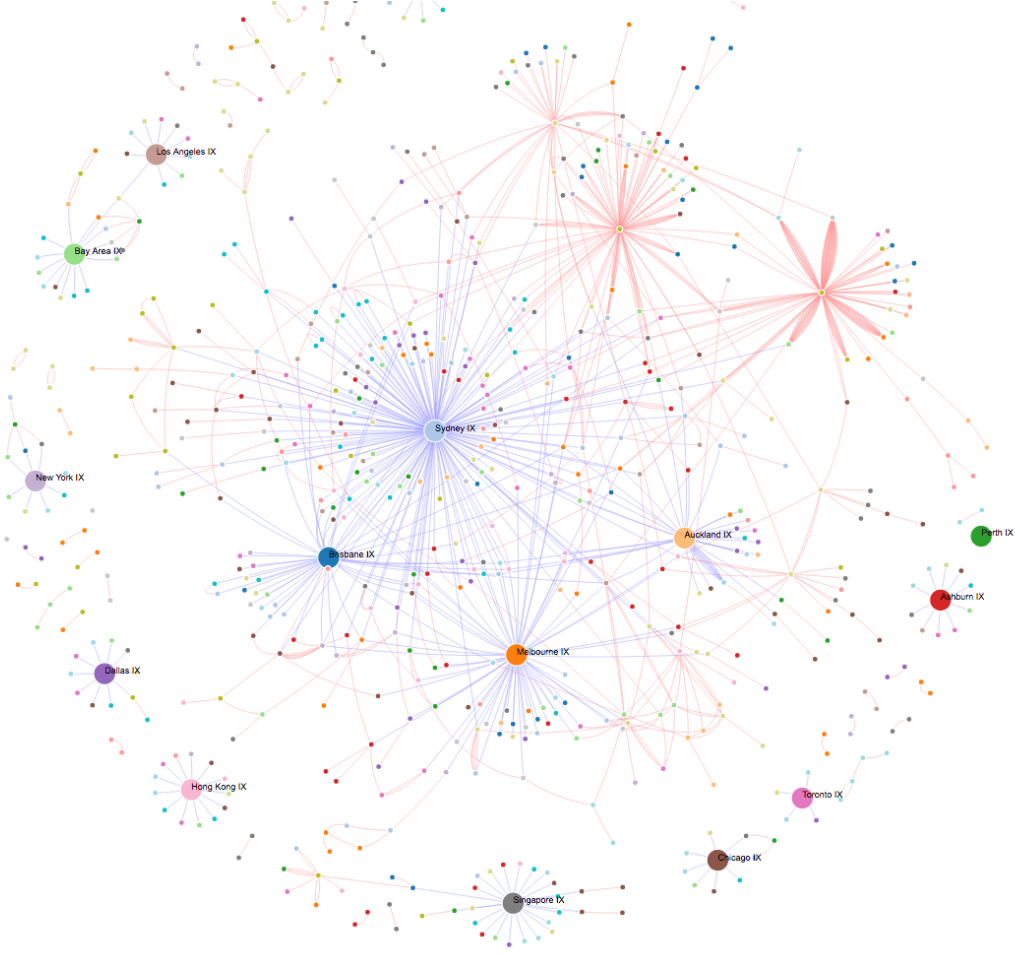
In this visualisation, the network nodes (ports) are arranged in a ring, with ports that are owned by the same company ordered next to each other. In this visualisation, there is no particular geographical significance to the ordering of ports. Connections between ports are drawn as lines - the short loops between adjacent ports are the private networks, and lines going across the ring represent links between different customers.
As we sell more ports, the number of possible connections grows exponentially. This is in fact what we have seen over time. 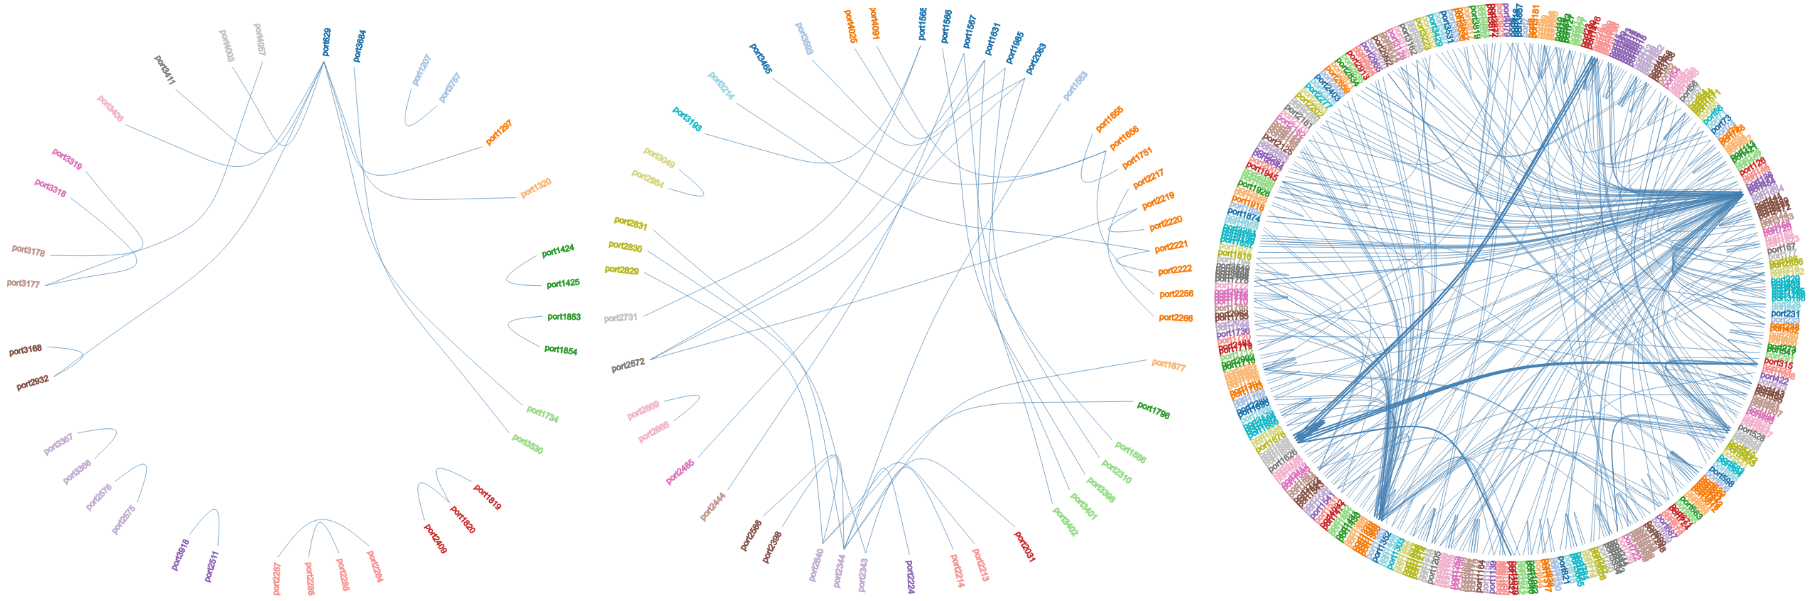
In this close-up of the graph, we can see a cloud provider with a lot of connections, as well as some examples of cross-ring connections 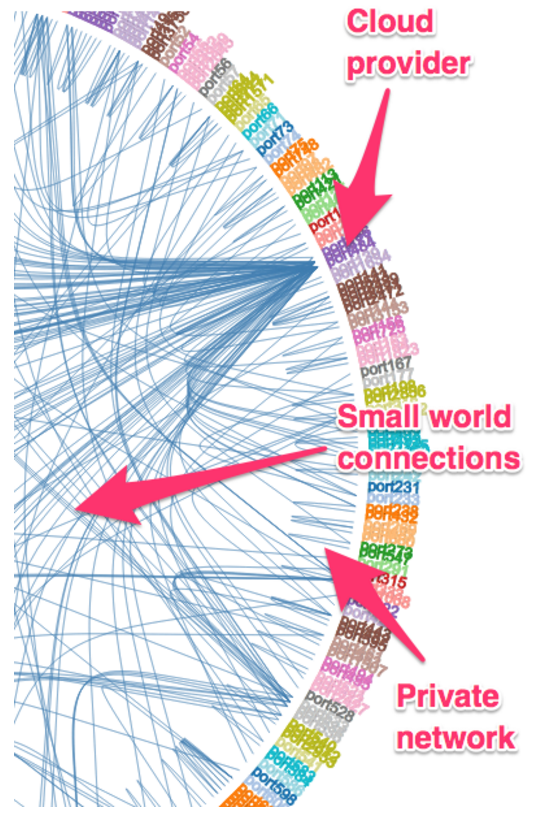
The Hive Plot approach was developed by Martin Krzywinski and is described in more detail here. The key aspect of the Hive Plot is that nodes are displayed on different axes, but the connections are still drawn between them. In the plot below, the top vertical axis with blue dots represents each of the 15 internet exchanges - so by definition any line connected to the blue dots is an IX service. The blue dots are arranged by geography; Australia / New Zealand, North America, and Singapore / Hong Kong respectively out from the centre. The bottom vertical axis represents the ports owned by cloud service providers, similarly grouped geographically. The other four axes represent customer ports in four different geographies:
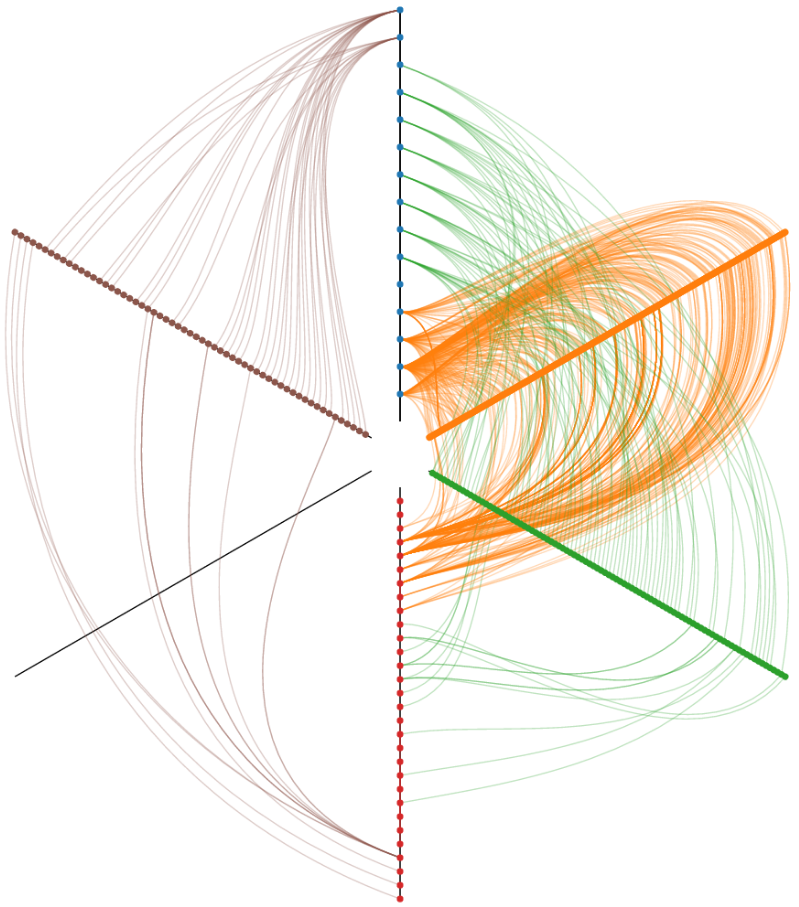 In this visualisation, you can see that in the Australia / new Zealand market, IX and VXC is fairly equally represented. By contrast, the other markets seem to be IX biased. This visualisation technically contains the same information as the hairball / pizza above, but the power of this approach is that you can extract meaning more easily by pulling nodes onto different axes.
A picture tells a thousand words, and the Edge Graph visualisations of our growth over time has appeared in our prospectus and annual reports.
There are numerous formal metrics that describe graphs. From our business perspective, the more services attached to a port, the ‘stickier’ it is. The formal metrics relevant to this are the Vertex Degree, and the Vertex Connectivity
Not so long ago, the cloud was somewhat of an experiment, with just AWS leading the way, and very little choice in terms of service offerings. Now the cloud is the default setting, and there are a number of mature and competitive offerings by the big players like Amazon, Microsoft, Google with a large number second tier providers. The cloud is not without risk, and are finding that a number of customers are spreading their risk by connecting to two or more cloud providers. Since Megaport has deep network integration to all of the major cloud providers, we are uniquely positioned to provide one-click2 connectivity from a single customer port to every cloud provider on our network! I think that is a pretty cool offering. From the Force Graph visualisation, it is easy to spot those multi-cloud customers, and quickly see who they are connecting to, and in what markets. 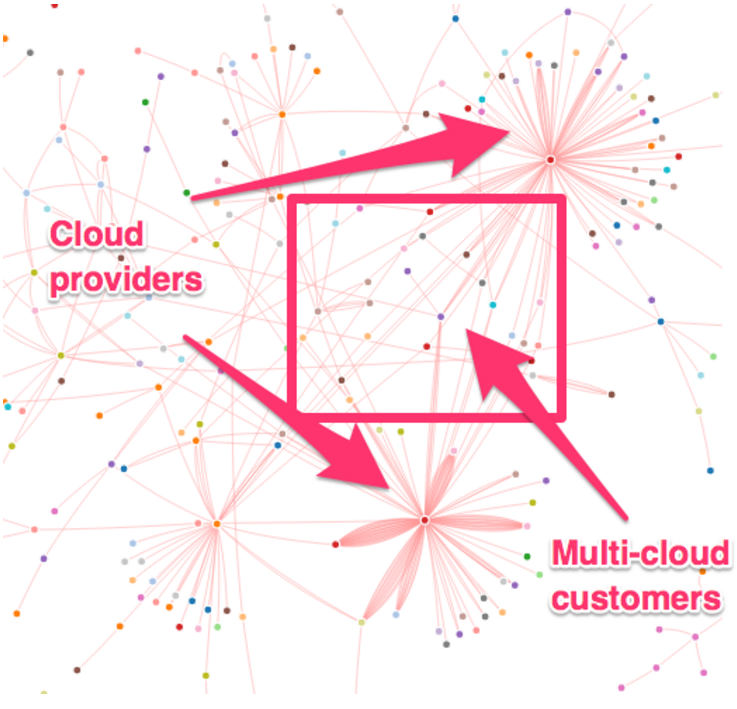
The images in the blog post have been created using the excellent D3 JavaScript library; you can see examples of what it can do here. For a little more serious network analysis, you might want to check out a desktop application called Gephi. If you want to get into the statistical side of your data as well as awesome plotting capabilities, the R language will take you pretty much anywhere you want to go.
Notes
[1] There is a thing called the OSI Network Model that is often used to describe Internet services - it starts at “layer 1” which is stuff like fibre-optic cable in the ground, layer 3 is IP addresses, and so on up to “layer 7” which is mostly cat videos. I learned a mnemonic 20 years ago to remember the layers: 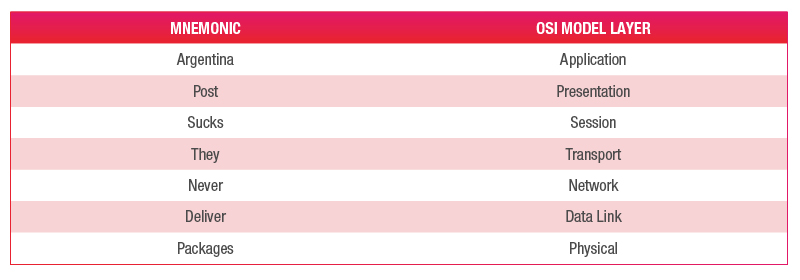 [2] Already patented - I checked, D’Oh!
此内容由惯性聚合(RSS阅读器)自动聚合整理,仅供阅读参考。 原文来自 — 版权归原作者所有。