


amChart控件是一套基于js+falsh的图形控件,折腾了两天,参考了网上前人总结的使用方法,终于基本能够使用了。顺便说一句,官网上的document实在是不太方便,也没有一个api的说明。
首先当然是添加对am.charts.dll的引用,可以添加到工具箱里,以后使用的时候直接把常用的5种图形按需要拖到web里。
添加数据的方式一种是写在一个cvs或xml文件里,不过这样对动态生态的图片实在是操作起来不太方便。通常通过后台添加数据,此次通过使用dropdownlist确定查询数据的ID,从而得到dataset,然后添加到amchart里,以linechart为例。具体代码如下,在DropDownList1_SelectedIndexChanged事件里:
1 //清空原有图形
2 LineChart1.Graphs.Clear();
3 //准备数据
4 //Response.Write(DropDownList1.SelectedValue + "," + DropDownList1.SelectedItem);
5 string sql = "SELECT stcd,DATENAME(YEAR,tm)+DATENAME(MONTH,tm) as date,SUM(dyp) as dyp from ST_PPTN_R WHERE stcd='" +
6 DropDownList1.SelectedValue +
7 "' GROUP BY stcd,DATENAME(YEAR,tm)+DATENAME(MONTH,tm) ORDER BY stcd,date ";
8 DataSet dataSet =
9 SqlHelper.ExecuteDataset(
10 ConfigurationManager.ConnectionStrings["RWDB"].ConnectionString, CommandType.Text,
11 sql);
12 //添加数据线对象
13 LineChartGraph lineChartGraph = new LineChartGraph();
14 //顶点形状为正方形
15 lineChartGraph.Bullet = LineChartBulletTypes.Square;
16 //顶点颜色
17 //lineChartGraph.BulletColor = Color.Yellow;
18 //向下面积图的颜色
19 lineChartGraph.FillColor = Color.Yellow;
20 //向下面积图的透明度
21 lineChartGraph.FillAlpha = Convert.ToByte(40);
22 //添加数据
23 //Y轴值在右边(默认在左边)
24 //lineChartGraph.Axis = LineChartAxes.Right;
25
26 lineChartGraph.DataSource = dataSet;//数据源
27 lineChartGraph.DataSeriesItemIDField = "date";//标识字段
28 lineChartGraph.DataValueField = "dyp";//值字段
29 lineChartGraph.Title = DropDownList1.SelectedItem.Text.Trim();//数据系列标题
30 //添加线条到图形
31 LineChart1.Graphs.Add(lineChartGraph);
32
33 //添加平均值线条
34 double averagePre = 0;
35 int count = 0;
36 foreach (DataRow dataRow in dataSet.Tables[0].Rows)
37 {
38 if (dataRow["dyp"] != DBNull.Value)
39 {
40 averagePre += Convert.ToDouble(dataRow["dyp"]);
41 count++;
42 }
43 }
44 //Response.Write("average=" + averagePre.ToString() + ",count=" + count.ToString());
45 averagePre /= count;
46 averagePre = Math.Round(averagePre, 2);//保留两位小数
47 DataColumn dc_v = new DataColumn("average");//添加平均值的数据列到原dataset里
48 dataSet.Tables[0].Columns.Add(dc_v);
49 for (int i = 0; i < dataSet.Tables[0].Rows.Count; i++)
50 {
51 dataSet.Tables[0].Rows[i][dc_v] = averagePre;
52 }
53 LineChartGraph lcg = new LineChartGraph();
54 lcg.DataSource = dataSet;
55 lcg.DataSeriesItemIDField = "date";
56 lcg.DataValueField = "average";
57 lcg.Title = "平均值";
58 LineChart1.Graphs.Add(lcg);
59 //添加Y轴单位说明
60 LineChart1.Labels.Add(new ChartLabel("mm",new Unit(30),new Unit(30))); //单位为mm
61 LineChart1.DataSource = dataSet;
62 LineChart1.DataSeriesIDField = "date";
63 LineChart1.DataBind();
几个需要注意的问题:
1.图形大小的设置
//设置图形的宽高
LineChart1.Width = new Unit(600);
LineChart1.Height = new Unit(400);
2.若不是采用dropdownlist等动态生成数据,web页面比较简单,没有重复生成图形的时候,可不用LineChart1.Graphs.Clear();来清空原图。若像我这样,每次通过点击dropdownlist来显示不同的数据的时候,需要加上LineChart1.Graphs.Clear()来清空原图,并且要设置linechart1的enableviewstate属性为false,否则会发现点击dropdownlist的时候显示的还是原来的数据,而且显示的数据不完整。这个问题折腾了我半天才发现。
3.数据绑定
在lineChartGraph对象里要设置其 DataSource ,DataSeriesIDField ,DataValueField三个参数,但设置完了之后,在LineChart1里仍然需要设置其 DataSource ,DataSeriesIDField,否则显示不出图像。同样两个对象都需要DataBind()。
4.双坐标轴
可以通过lineChartGraph.Axis = LineChartAxes.Right;来更改坐标轴的位置,通常默认在左边,当添加另一条线的时候可以设计其坐标轴在右边从而分开显示。
QQ截的图,显示的不太清楚,实际上flash的图片显示效果要好很多。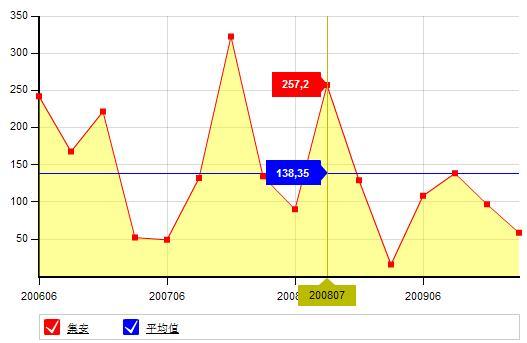
此内容由惯性聚合(RSS阅读器)自动聚合整理,仅供阅读参考。 原文来自 — 版权归原作者所有。