惯性聚合 高效追踪和阅读你感兴趣的博客、新闻、科技资讯
阅读原文 在惯性聚合中打开

推荐订阅源

The GitHub Blog
The GitHub Blog
云风的 BLOG
云风的 BLOG
T
Threatpost
WordPress大学
WordPress大学
CTFtime.org: upcoming CTF events
PCI Perspectives
PCI Perspectives
T
The Exploit Database - CXSecurity.com
Y
Y Combinator Blog
雷峰网
雷峰网
爱范儿
爱范儿
The Hacker News
The Hacker News
Last Week in AI
Last Week in AI
Simon Willison's Weblog
T
Tor Project blog
S
Securelist
宝玉的分享
宝玉的分享
L
LangChain Blog
O
OpenAI News
AI
AI
P
Privacy International News Feed
L
LINUX DO - 最新话题
D
DataBreaches.Net
Exploit-DB.com RSS Feed
Attack and Defense Labs
罗磊的独立博客
M
MIT News - Artificial intelligence
Security Archives - TechRepublic
月光博客
月光博客
博客园 - 【当耐特】
T
Tailwind CSS Blog
C
Cybersecurity and Infrastructure Security Agency CISA
H
Help Net Security
freeCodeCamp Programming Tutorials: Python, JavaScript, Git & More
博客园_首页
K
KPMG report finds enterprise disconnect between AI and its ROI | CIO
Hacker News - Newest:
Hacker News - Newest: "LLM"
腾讯CDC
Jina AI
Jina AI
The Last Watchdog
The Last Watchdog
K
Kaspersky official blog
Webroot Blog
Webroot Blog
奇客Solidot–传递最新科技情报
奇客Solidot–传递最新科技情报
Blog — PlanetScale
Blog — PlanetScale
MyScale Blog
MyScale Blog
MongoDB | Blog
MongoDB | Blog
P
Proofpoint News Feed
Recorded Future
Recorded Future
Threat Intelligence Blog | Flashpoint
博客园 - 三生石上(FineUI控件)
The Cloudflare Blog

JetBrains News

What’s New in WebStorm 2026.1 What's New in DataSpell 2026.1 TeamCity: the Hassle-Free CI/CD Tool by JetBrains YouTrack: Project management for all your teams PhpStorm: The PHP IDE by JetBrains What's New in PhpStorm 2026.1 What’s New in PyCharm 2026.1 – Rethink How You Build and Scale What’s New in PyCharm 2026.1 – Rethink How You Build and Scale What's New in PhpStorm 2026.1 What's New in PhpStorm 2026.1 What's New in PhpStorm 2026.1 What's New in PhpStorm 2026.1 What's New in PhpStorm 2026.1 AppCode: Smart Swift/Objective-C IDE for iOS & macOS Development AppCode: Smart Swift/Objective-C IDE for iOS & macOS Development What's New in CLion 2026.1 CLion: A cross-platform IDE for C and C++ WebStorm: The JavaScript and TypeScript IDE, by JetBrains Rider: the cross-platform .NET and game development IDE from JetBrains Download ReSharper: Visual Studio Extension for .NET Devs dotMemory: a Memory Profiler & Unit-Testing Framework for .NET by JetBrains Hub: Identity management service for YouTrack and TeamCity Hub: Identity management service for YouTrack and TeamCity What's New in IntelliJ IDEA What's New in ReSharper What's New in DataGrip 2026.1 What's New in Rider What's New in GoLand 2026.1 What’s New in YouTrack 2026.1 JetBrains: Essential tools for software developers and teams What's New in RubyMine 2026.1 Free PyCharm For Students Free PyCharm For Students JetBrains: Essential tools for software developers and teams What's New in TeamCity 2026.1 | TeamCity On-Premises What's New in IntelliJ IDEA Security update for IntelliJ-based IDEs v2016.1 and older versions | The JetBrains Blog JetBrains: Essential tools for software developers and teams Monthly and yearly plans with JetBrains Toolbox Free PyCharm For Students What's New in dotPeek What’s New in YouTrack 2026.1 What's New in RubyMine 2026.1 What's New in ReSharper
What's New in dotMemory
2014-10-01 · via JetBrains News

This page details the latest updates and changes in dotMemory.

Reworked Monitoring tool window in JetBrains Rider 2025.2

The Monitoring tool window in Rider has been reworked to provide a more visual and integrated profiling experience. It now includes interactive charts for CPU usage, memory consumption, and garbage collection (GC) activity, giving you an at-a-glance view of your application's runtime behavior.

From the tool window, you can initiate performance or memory profiling sessions for deeper analysis in the built-in dotTrace and dotMemory profilers or their standalone counterparts. On Windows, the Monitoring tool also automatically detects performance bottlenecks, UI freezes, and GC issues. Detected problems and time intervals selected on the charts can be further investigated in dotTrace.
Learn more

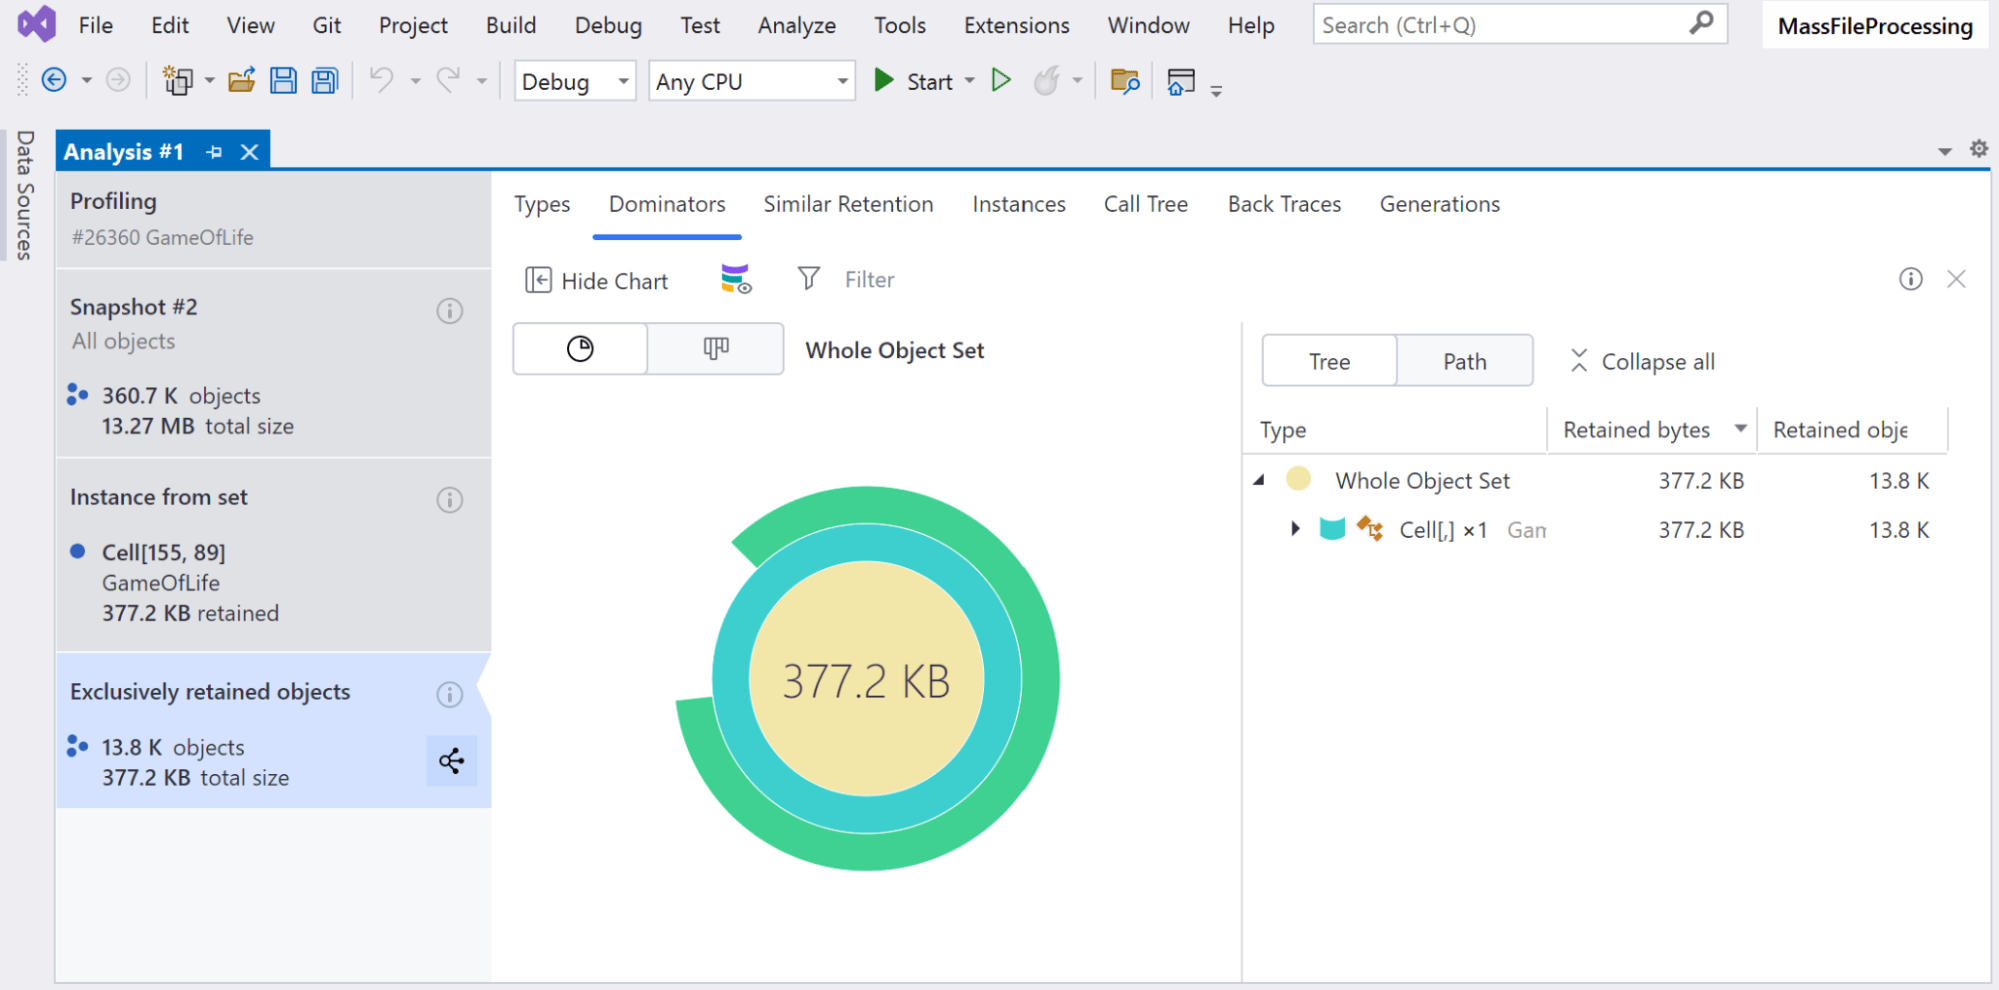
Snapshot analysis inside Visual Studio 2025.1

dotMemory is now fully integrated with Microsoft Visual Studio. Previously, you could only trigger profiling from within Visual Studio, but you had to switch to the standalone dotMemory application to analyze the results. Now, you can both profile your application and analyze memory snapshots without ever leaving the IDE.

User interface 2024.3

The 2024.3 update introduces a number of small UX/UI improvements, as well as the finishing touches that give all dotMemory versions across all operating systems a unified look and feel.

Creation Stack Trace view for object instances 2024.3

We've reintroduced the Creation Stack Trace view, which had previously been removed during the UI redesign. This view shows the function call stack that led to the creation of an object, helping you identify the root cause of memory issues more easily.

Back Traces view for object sets 2024.3

We’ve also reimplemented the Back Traces view for object sets. This inverted call tree in the view shows the call chain starting from the function that created a particular set of objects, moving from the bottom to the top.

Ability to visualize dominators with an icicle chart 2024.3

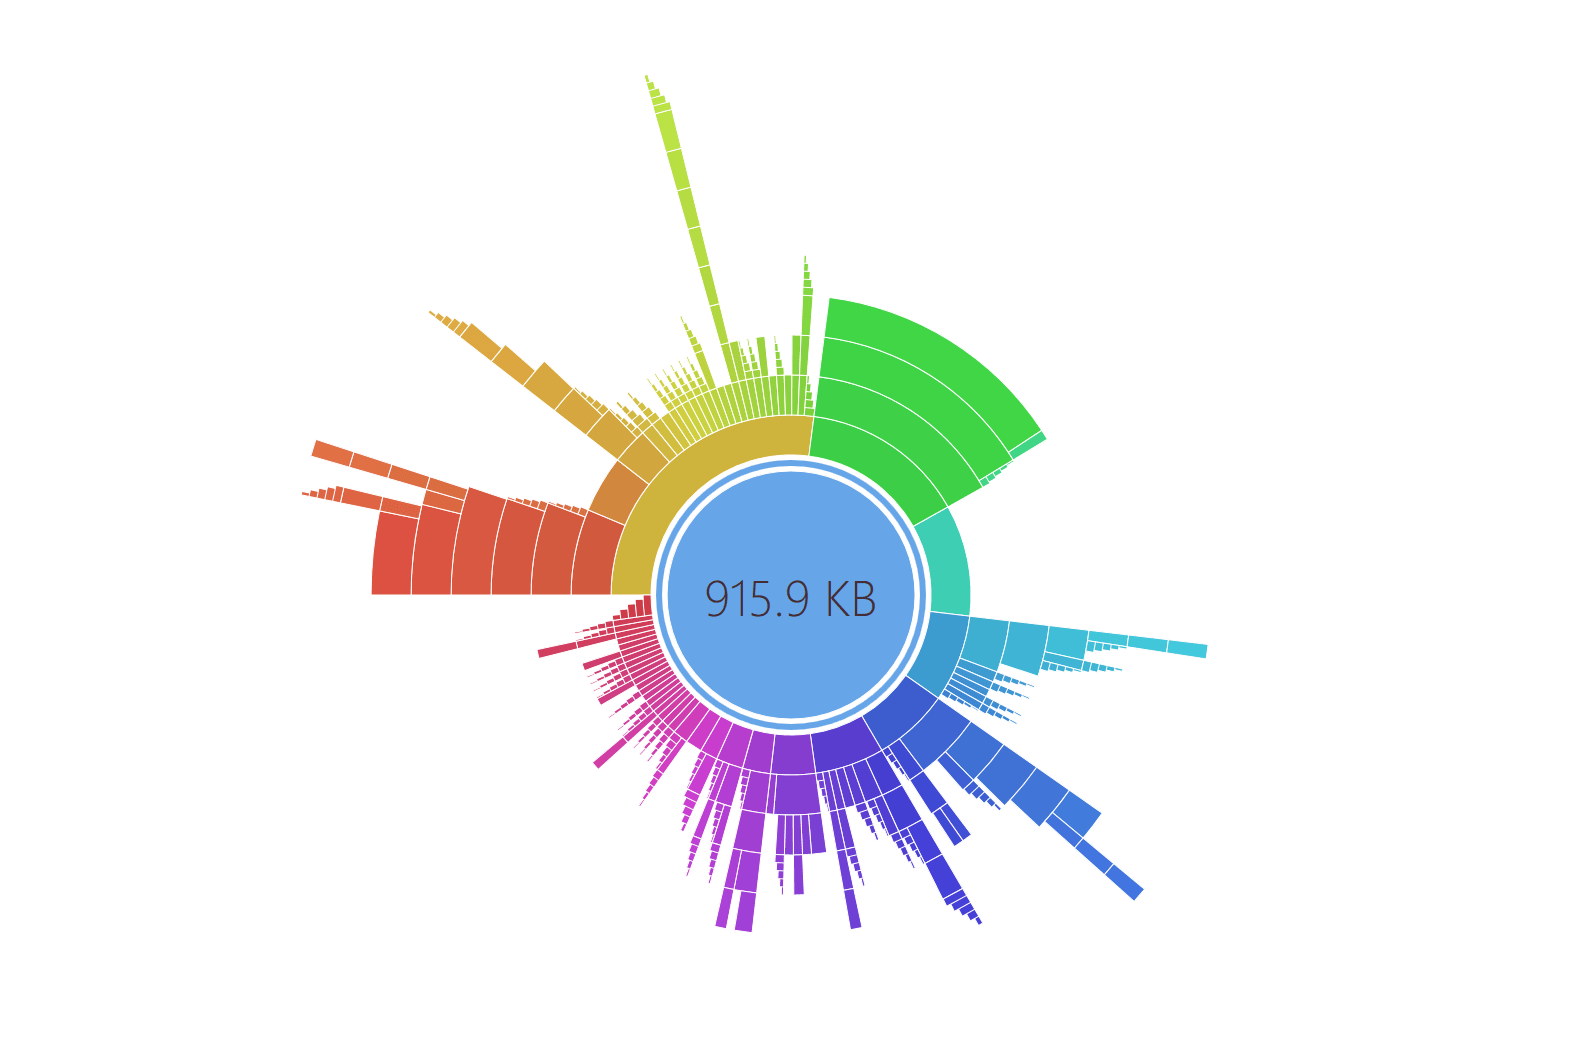
The dominator tree can now be displayed as an icicle chart, showing the memory consumption of the dominator and the retained objects. This feature is available on Windows, Linux, and macOS for both the standalone version of dotMemory and dotMemory in JetBrains Rider.

Call Tree with sunburst chart now available on all OS 2024.3

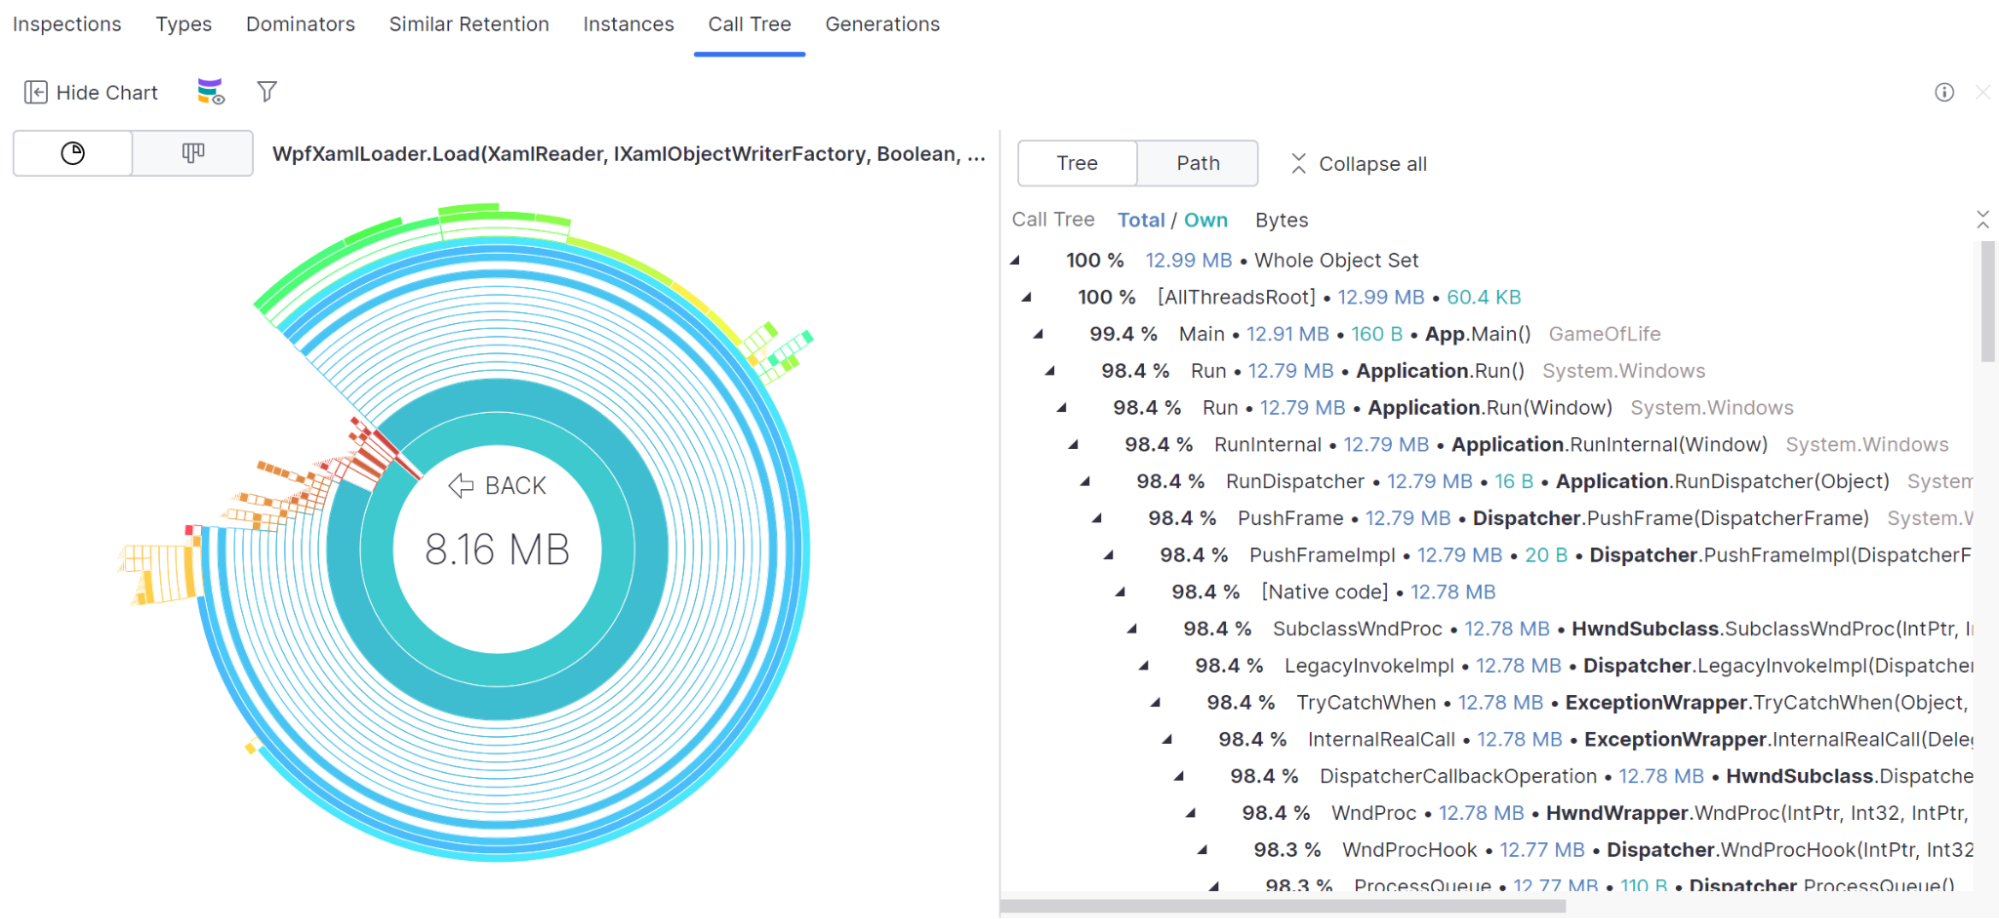
The ability to visualize a Call Tree as a sunburst chart, which was introduced in version 2024.2, is now available on Windows, Linux, and macOS for both the standalone version of dotMemory and dotMemory in JetBrains Rider.

Improved instance search 2024.2

We’ve added new filtering options to the Instancesview:

  • Search by string value: Type any string value into the filter field, and dotMemory will highlight matching strings. This makes it easier to find specific string instances based on their content.
  • Regex support for string values: Use regular expressions for more advanced searches. For example, ^nAsso.{5,}ID$ matches nAssociatedObjectID.nAssociatedObjectID.
  • Search by object address: You can also search for object instances by their memory address. This is useful for tracking specific objects directly.

These features are available in the standalone version of dotMemory and dotMemory in JetBrains Rider.
Improvements in dotMemory for Linux and macOS 2024.2

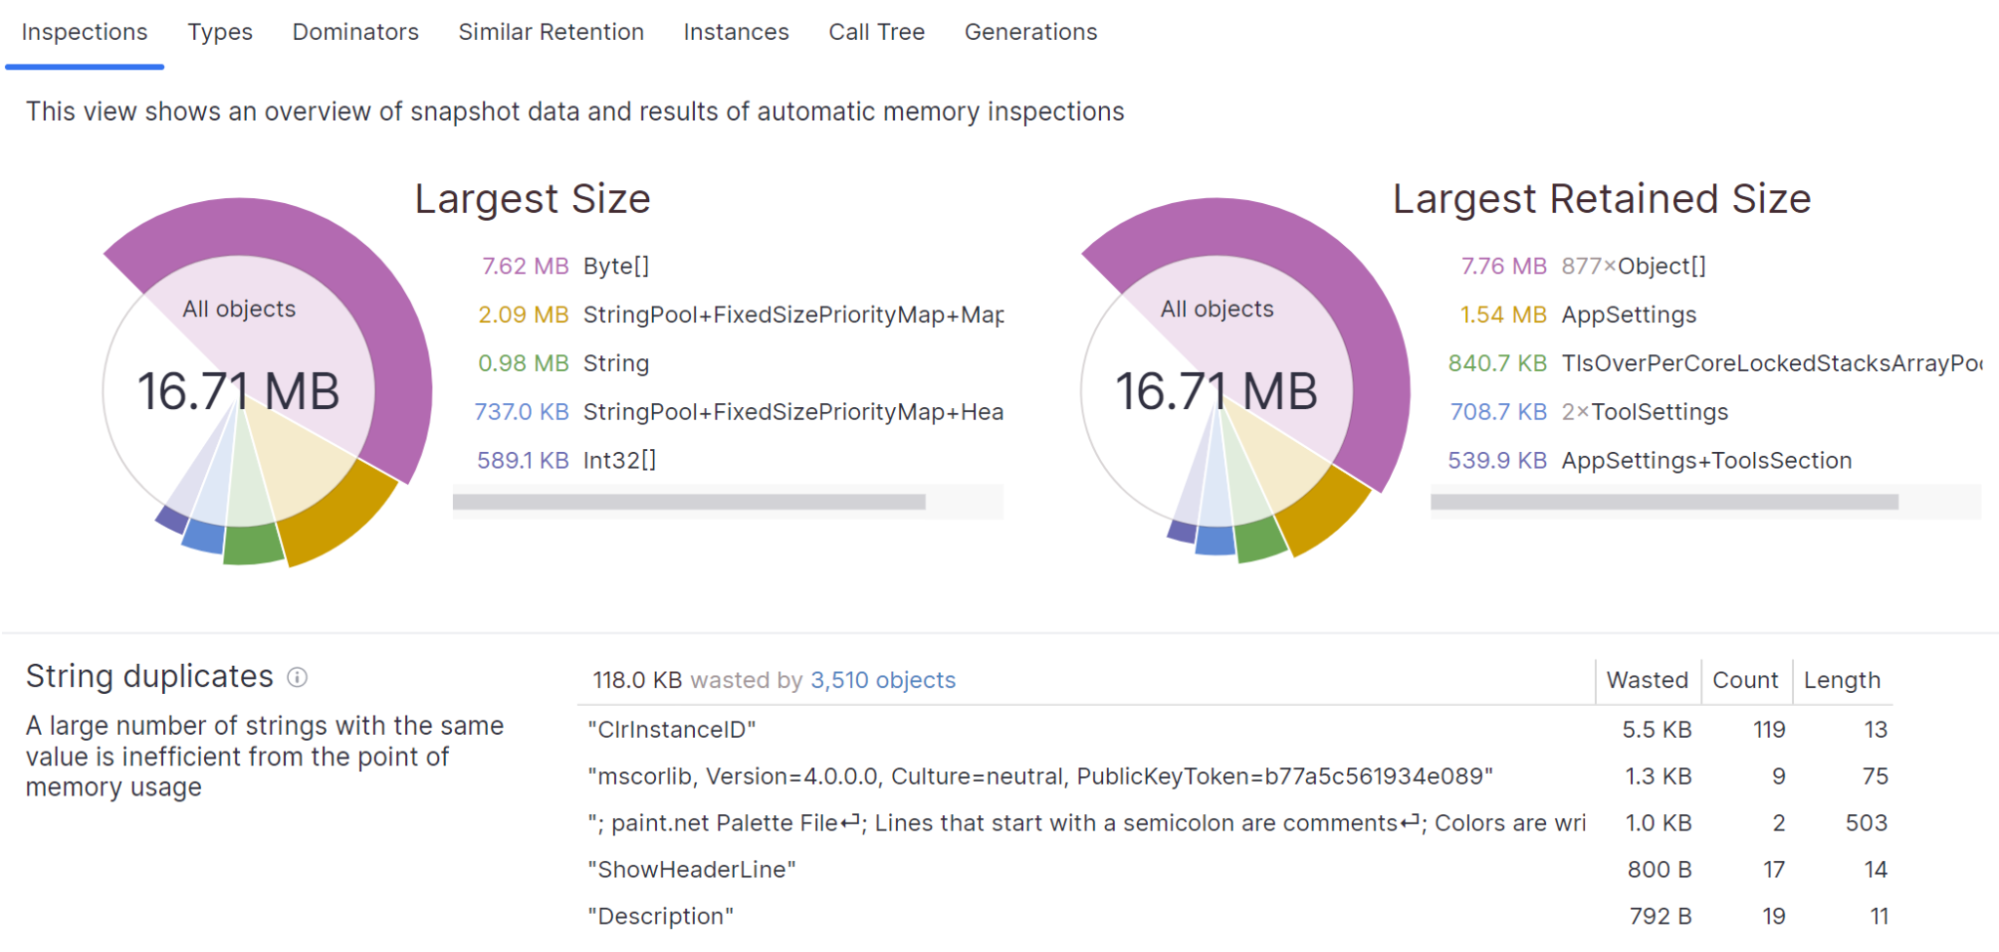
The dotMemory version for Linux and macOS gets features that were previously available only on Windows:

  • Automatic memory inspections: dotMemory for Linux and macOS gets the Inspections view, which shows several automatically detected memory issues.
  • Cross-workspace snapshot comparison: Now, you can compare snapshots from different profiling sessions.

These features are available in the standalone version of dotMemory and dotMemory in JetBrains Rider.
Visualize Call Tree with Sunburst chart 2024.2

The Call Tree can now be displayed as a Sunburst chart, highlighting functions that allocate the most memory. The feature is available in the standalone version of dotMemory (Linux and macOS) and dotMemory in JetBrains Rider (Windows, Linux, and macOS).
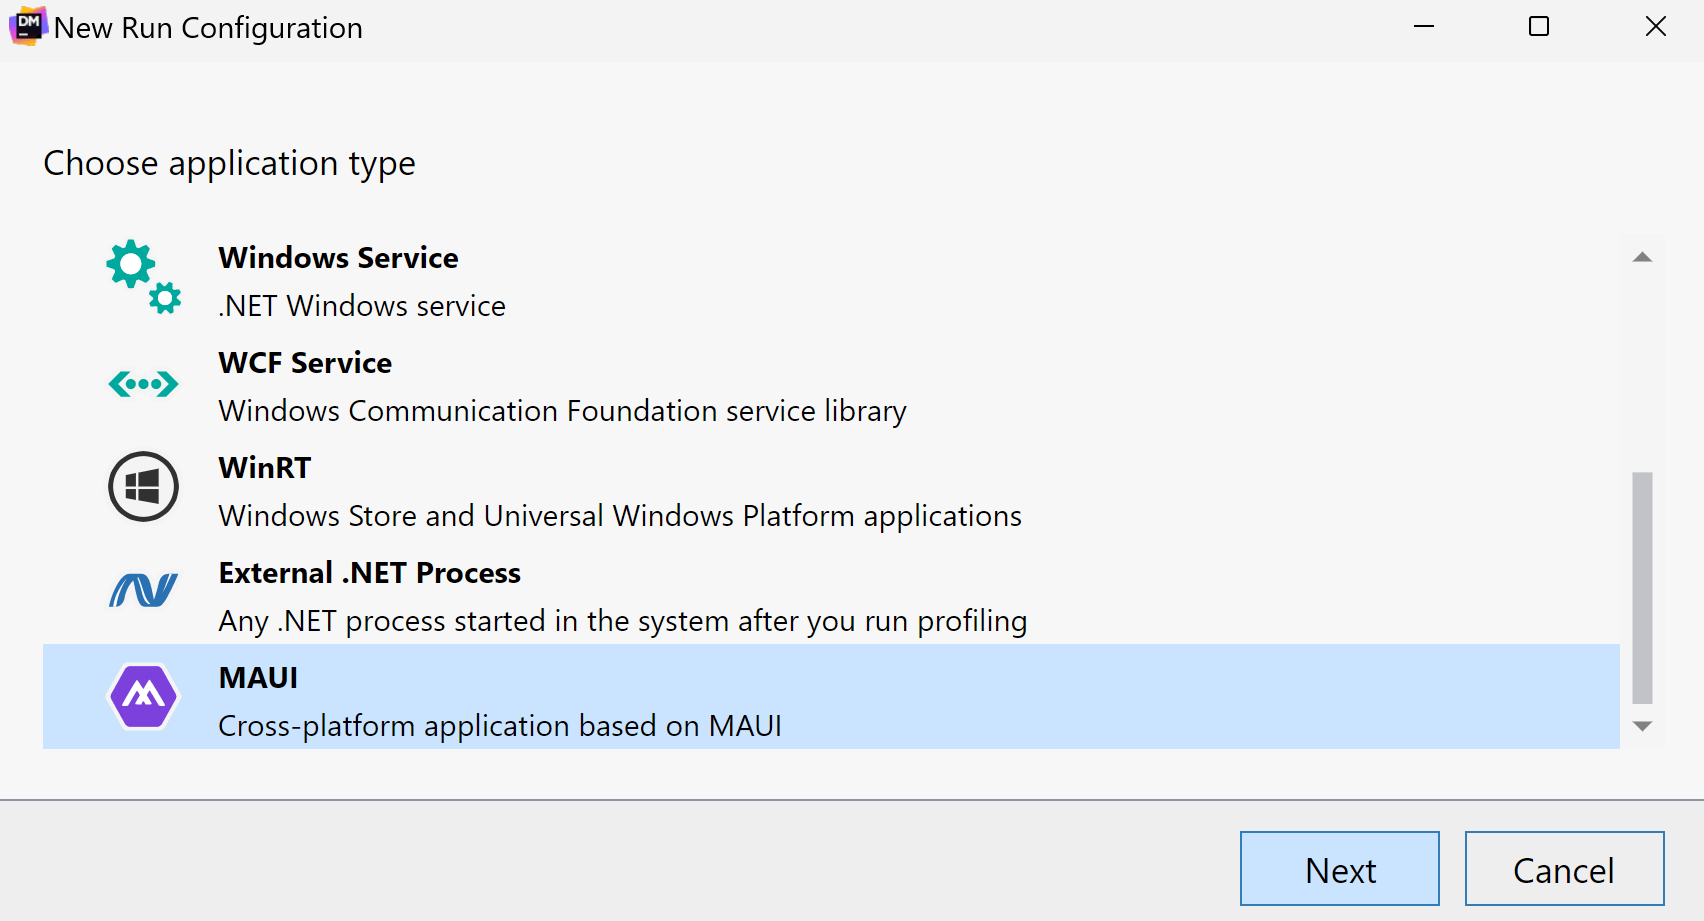
Support for MAUI applications

Support for MAUI applications 2024.1

Now, you can profile applications based on the MAUI framework.

Currently, dotMemory supports profiling of WinUI applications targeting .NET 7.0+ on Windows.

The support is available for dotMemory standalone and dotMemory integrated into Rider and ReSharper.
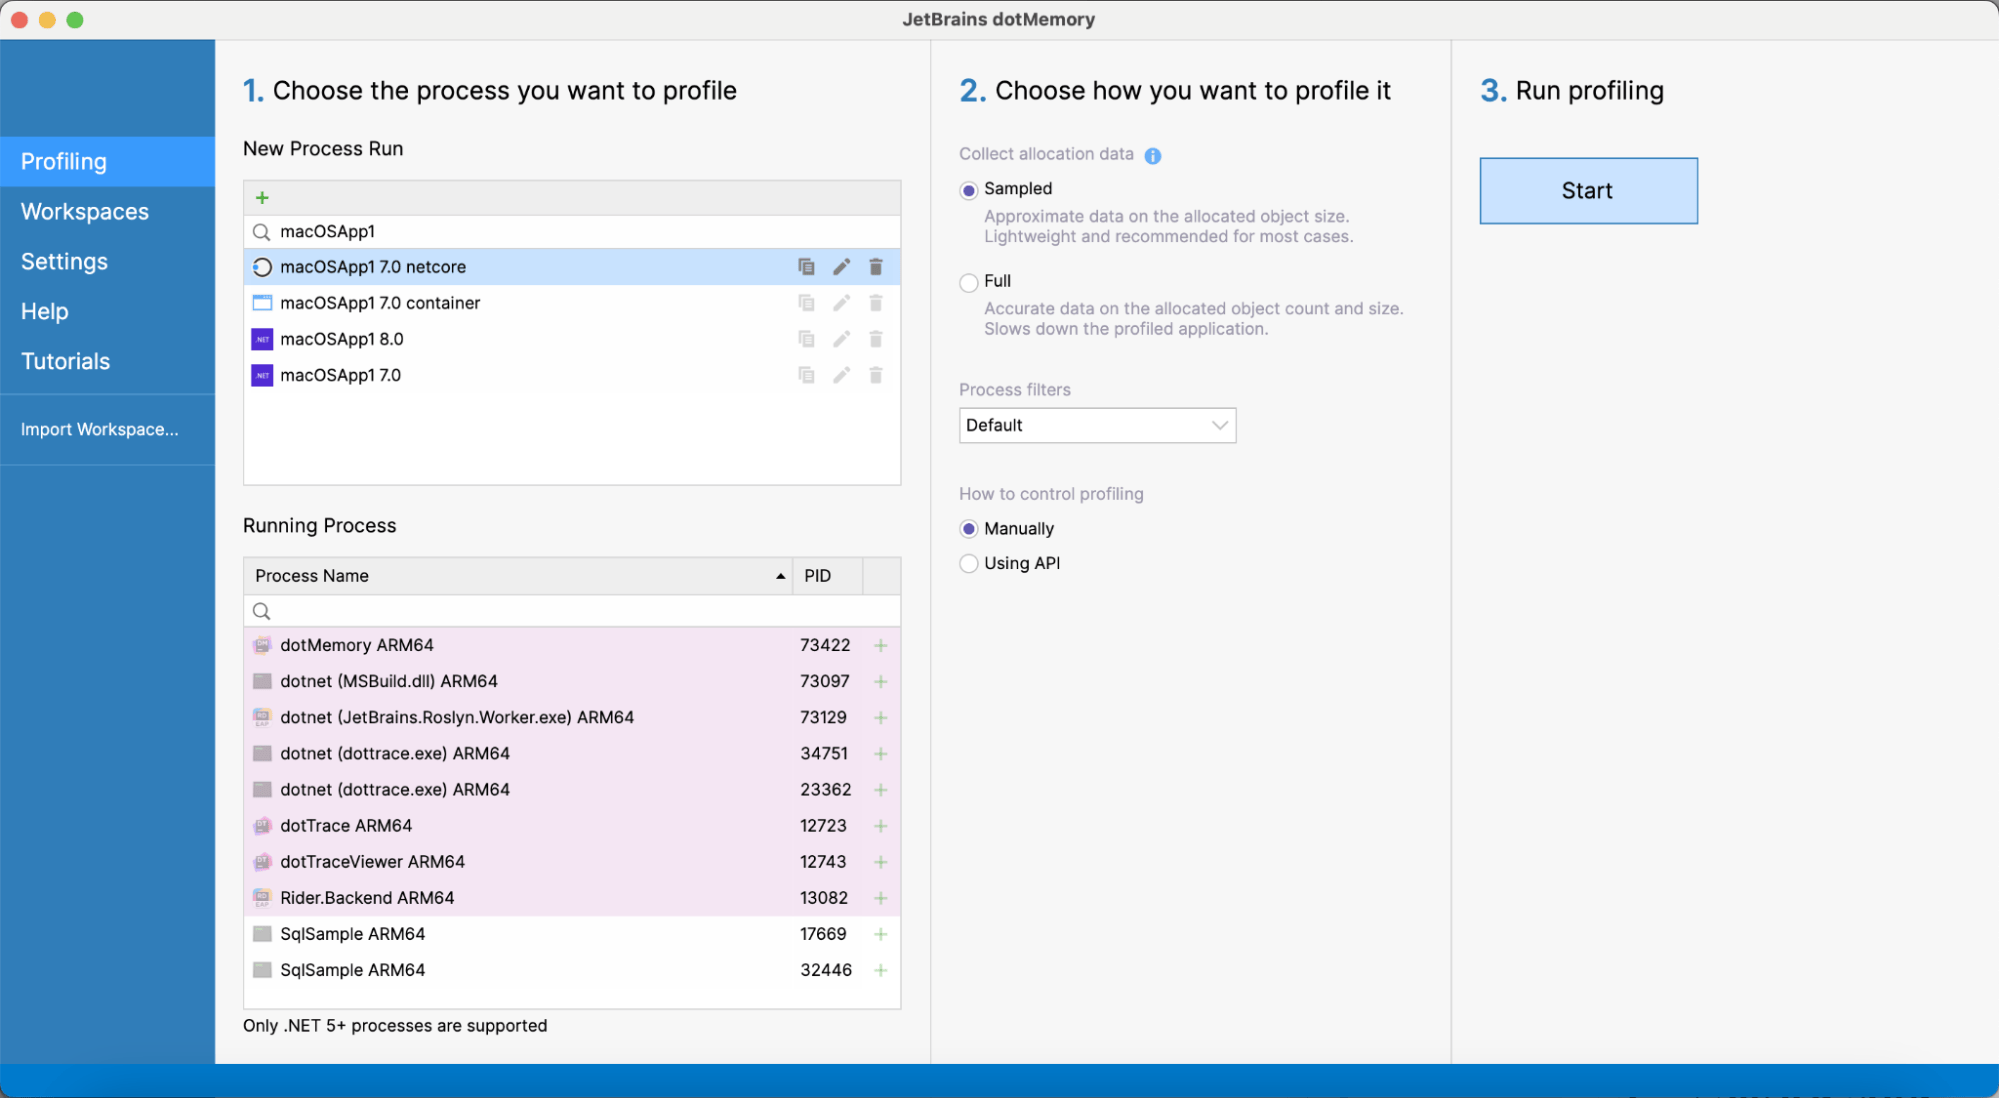
Improved support for macOS

Improved support for macOS 2024.1

  • Now, the standalone version of dotMemory lets you specify application bundles (.app) instead of executable files.
  • dotMemory in Rider can profile macOS run configurations. The following target frameworks are supported: net7.0-macos, net8.0-macos.

New views in dotMemory for Linux and macOS

New views in dotMemory for Linux and macOS 2024.1

The standalone version of dotMemory on Linux and macOS gets closer to its Windows counterpart, offering:
  • The Similar Retention view for analyzing object sets
  • The Sunburst diagram for analyzing dominator objects

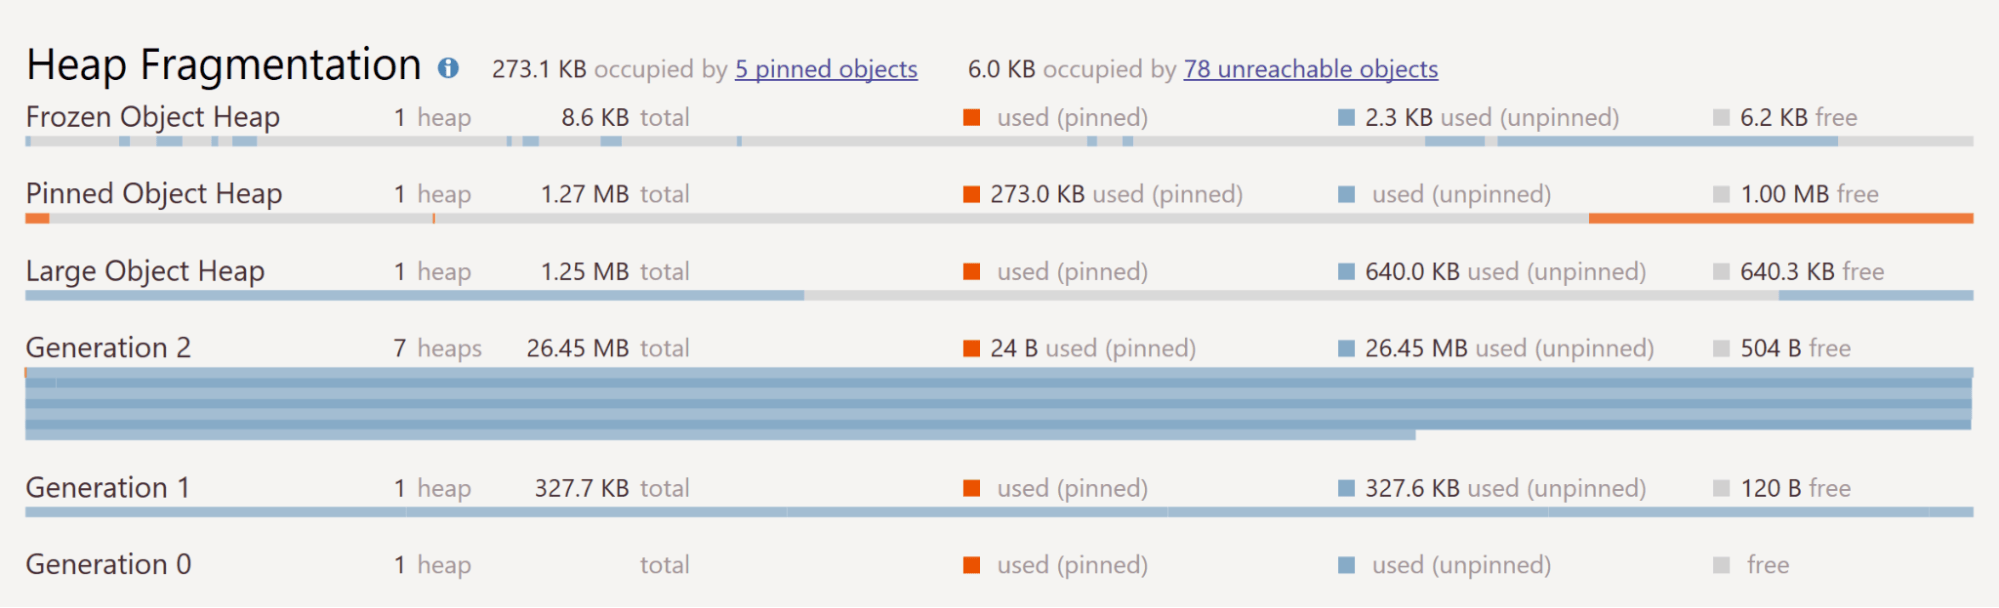
Support for Frozen Object Heap

Support for Frozen Object Heap 2024.1

The information about immutable objects in the Frozen Object Heap is shown on the timeline, the Heap Fragmentation diagram, and the Generations view.
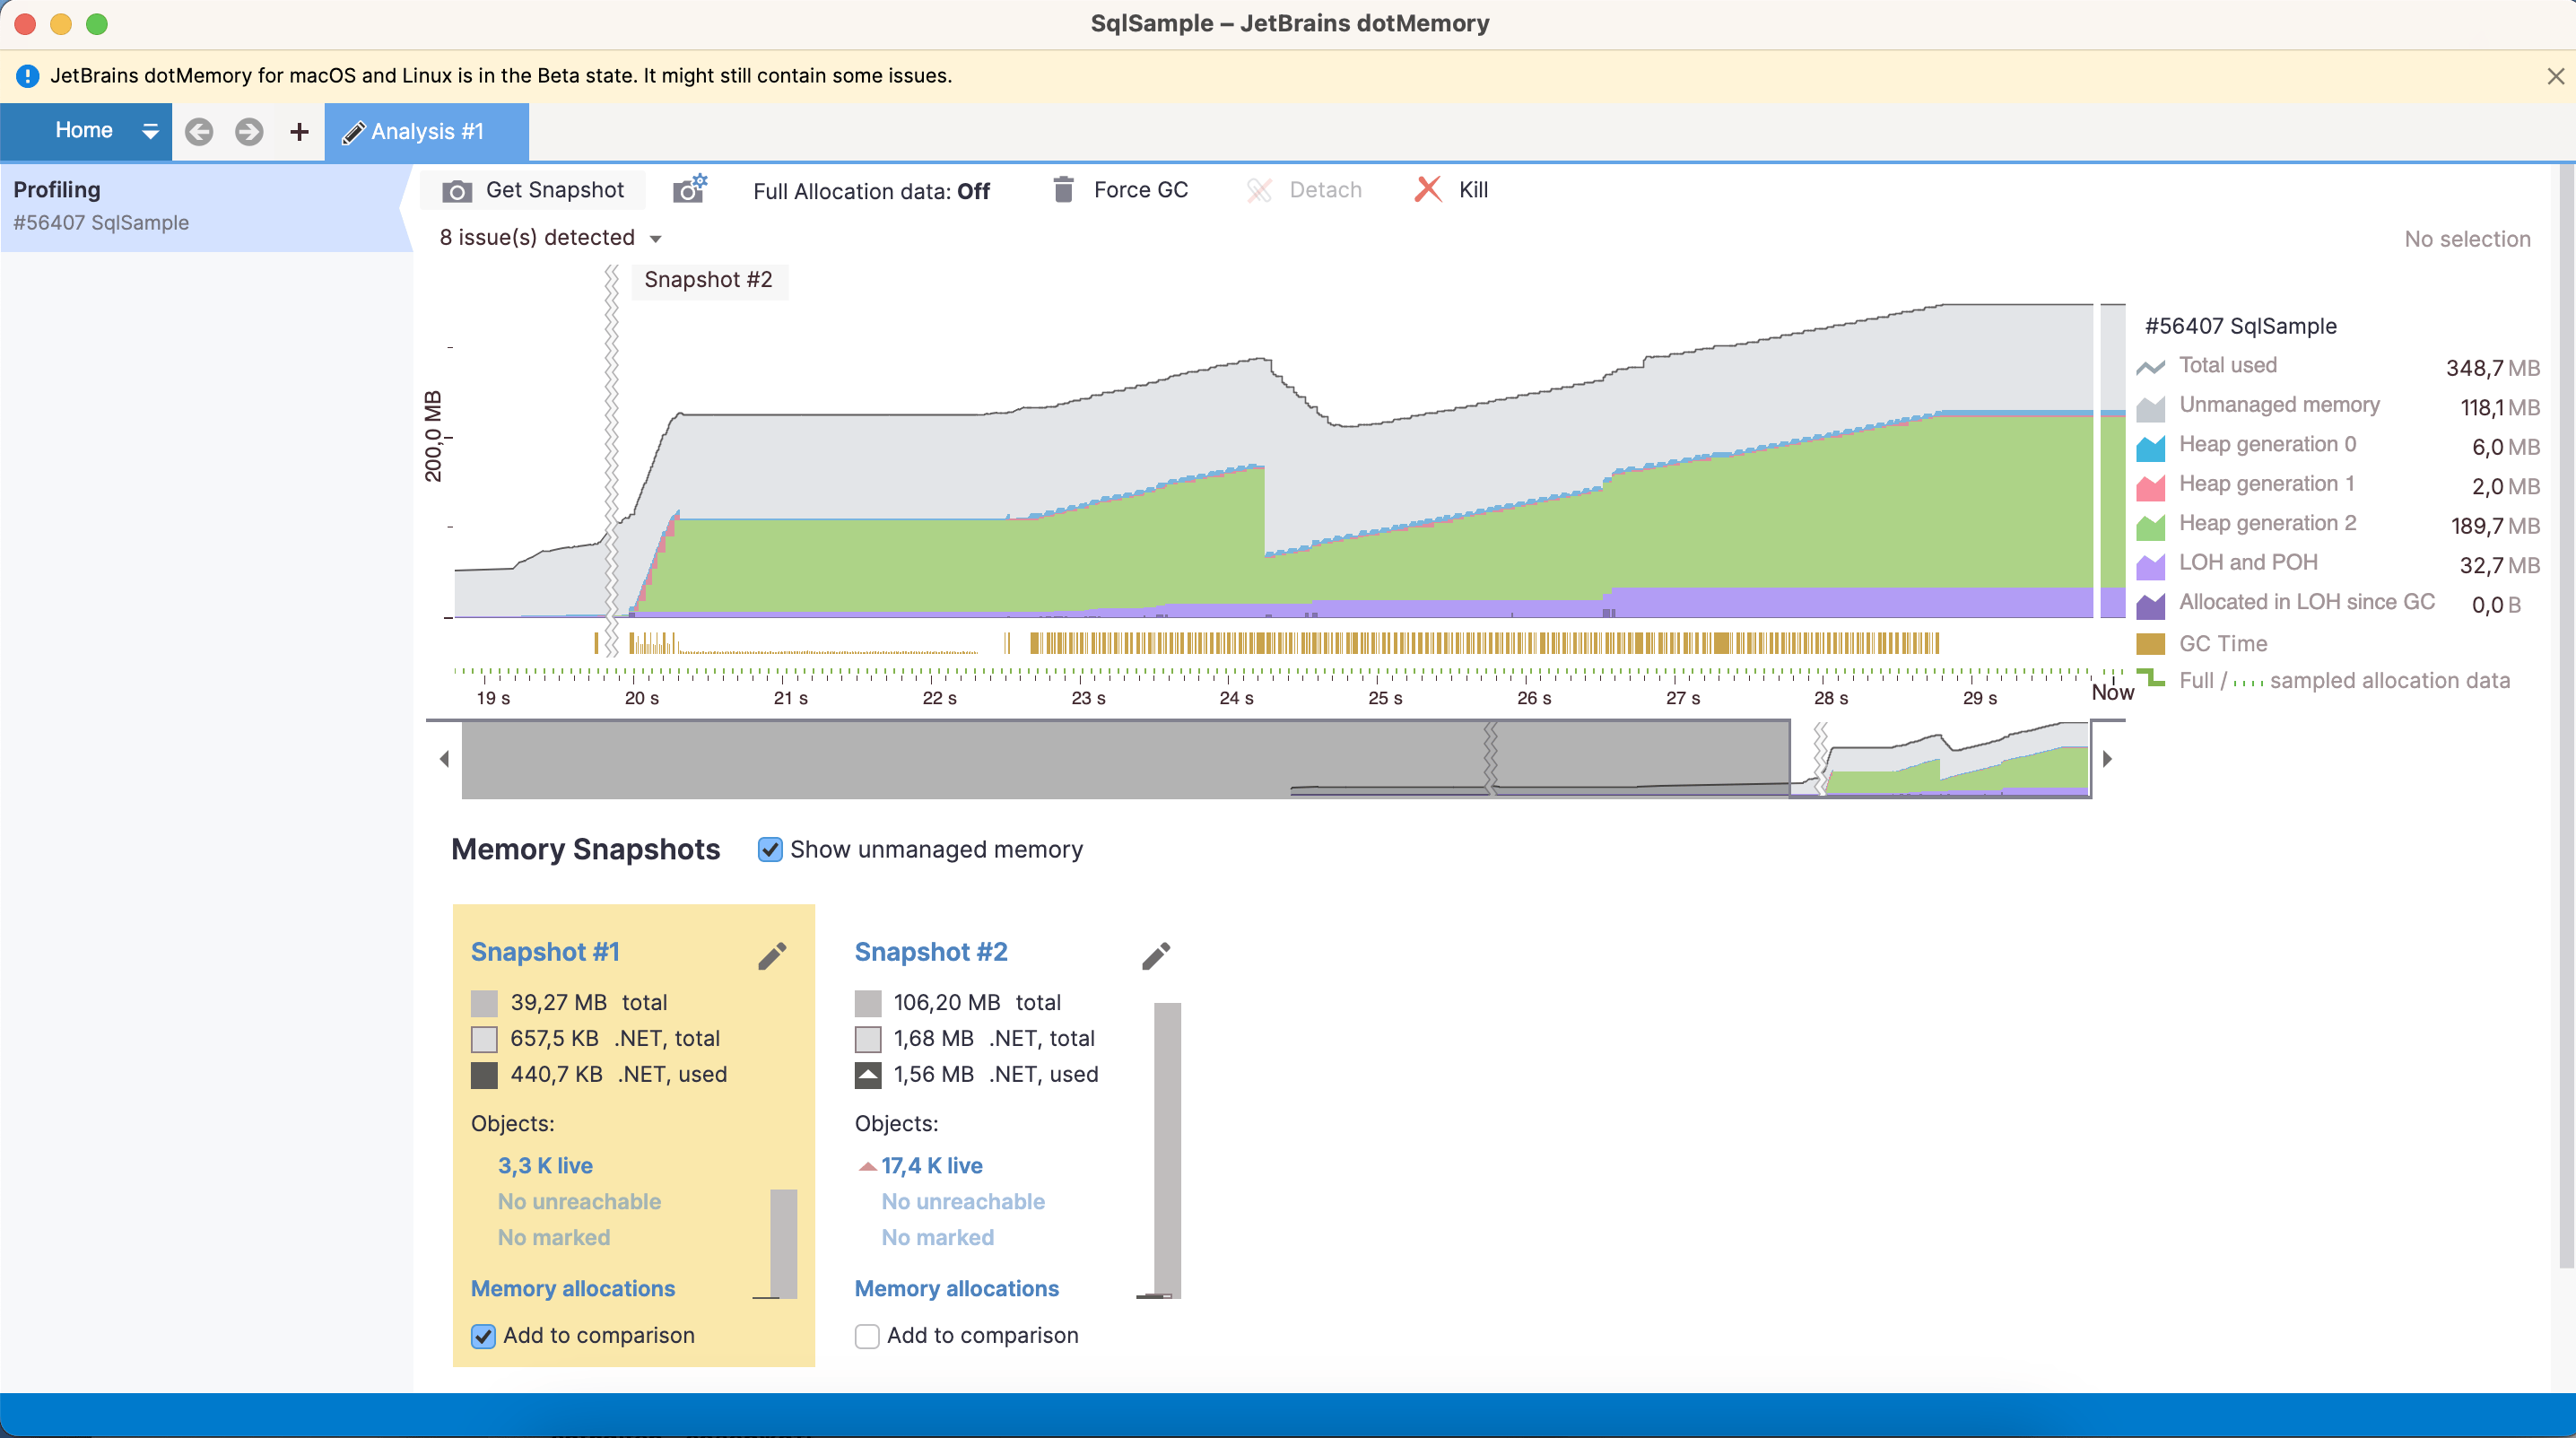
dotMemory Standalone on Linux and macOS

dotMemory Standalone on Linux and macOS 2023.3 Beta

Now, you can run the standalone version of dotMemory on Linux and macOS operating systems.

Analyze process dumps on Linux 2023.3

dotMemory now allows you to import and analyze process dumps as regular snapshots on Linux. Please note that the Linux version of dotMemory can only import dumps collected from processes running on the Linux OS.
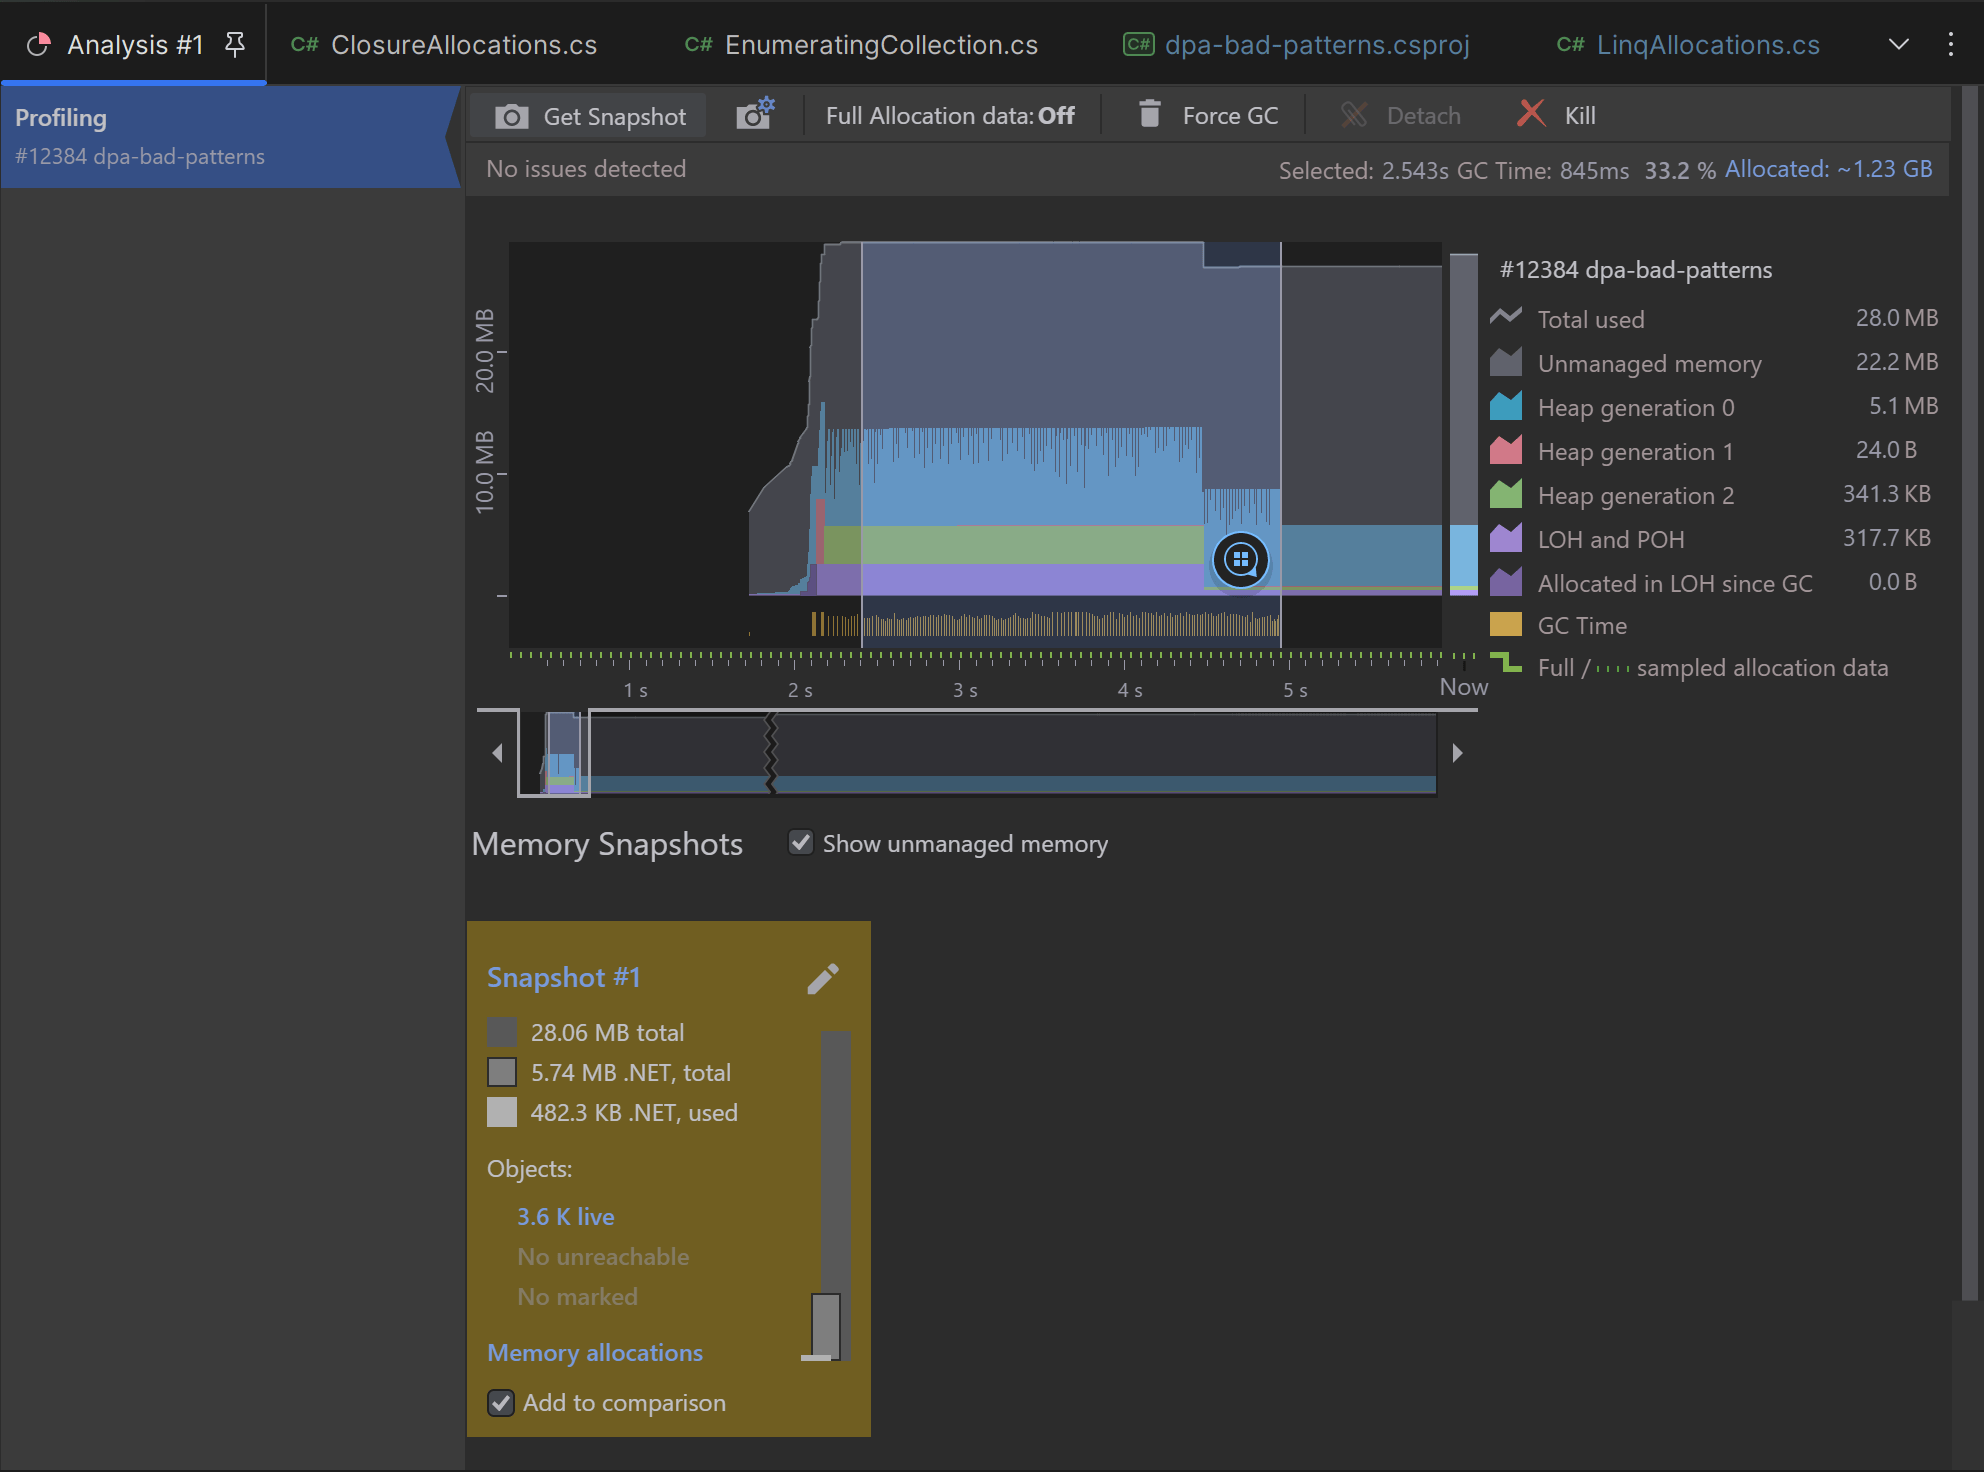
Snapshot analysis in JetBrains Rider

Snapshot analysis in JetBrains Rider 2023.2

Before 2023.2, you could only use dotMemory in Rider for memory allocation analysis. In 2023.2, you can collect memory snapshots and analyze them in Rider, just like in the standalone version of dotMemory.

  • Snapshot analysis is available on Windows, Linux, and macOS.
  • On Windows, you can also import and analyze process dumps.
  • Some features and views are not available, e.g., automatic snapshot inspections and creation stack trace views.