






这次来说说Area图的设置,还是以书店数据库为例,下面就列出2008年,2009年每个季度的收益对比
效图果如下:
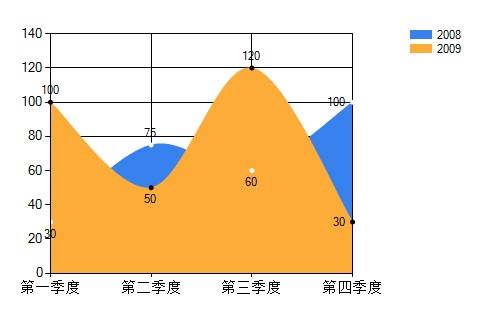
代码如下,对一些属性做了注释,有兴趣的同学可以试试
 代码
代码
System.Web.UI.DataVisualization.Charting.Chart Chart1 = new System.Web.UI.DataVisualization.Charting.Chart();
Chart1.Width = 500;
Chart1.Height = 296;
Chart1.RenderType = RenderType.ImageTag;
Chart1.Palette = ChartColorPalette.BrightPastel;
Chart1.BackGradientStyle = GradientStyle.TopBottom;
//设置2008年的数据
double[] yValues = { 30, 75, 60, 100};
string[] xValues = { "第一季度", "第二季度", "第三季度", "第四季度" };
Series series2008
= new Series();series2008.Name
= "2008";series2009.Name
= "2009";ChartArea charArea
= new ChartArea();charArea.Name
= "ChartArea1"; Chart1.ChartAreas.Add(charArea);
Chart1.ChartAreas[
Legend legend
= new Legend();Chart1.Legends.Add(legend);
// Render chart control好了,下次帖点高级的,关于drilldown功能
此内容由惯性聚合(RSS阅读器)自动聚合整理,仅供阅读参考。 原文来自 — 版权归原作者所有。