



惯性聚合 高效追踪和阅读你感兴趣的博客、新闻、科技资讯
阅读原文 在惯性聚合中打开

推荐订阅源

腾讯CDC
Microsoft Azure Blog
L
LangChain Blog
Y
Y Combinator Blog
Microsoft Security Blog
宝玉的分享
宝玉的分享
B
Blog RSS Feed
MongoDB | Blog
MongoDB | Blog
Jina AI
Jina AI
D
Docker
B
Blog
Engineering at Meta
Engineering at Meta
Last Week in AI
Last Week in AI
OSCHINA 社区最新新闻
OSCHINA 社区最新新闻
I
InfoQ
G
Google Developers Blog
博客园 - Franky
freeCodeCamp Programming Tutorials: Python, JavaScript, Git & More
让小产品的独立变现更简单 - ezindie.com
The GitHub Blog
The GitHub Blog
T
The Blog of Author Tim Ferriss
大猫的无限游戏
大猫的无限游戏
阮一峰的网络日志
阮一峰的网络日志
U
Unit 42

博客园 - 我不是冷狐冲,我就是一酒壶

又长草啦 普通HTML的input调用Ext js DatePicker的实现方法 MVC框架下的图表使用(二) 关于消息队列的研究 GridView样式及排序问题 新年新开始 WebBrowser控件显示XML流 VS2005(C#)里读取及改变App.config里appSettings节的值 WebService开发心得 - 我不是冷狐冲,我就是一酒壶 - 博客园 VS 2005 C#操作 XML ASP调用C# DLL - 我不是冷狐冲,我就是一酒壶 - 博客园 Ajax学习笔记 VML图表控件 含吃蛇,加了存档功能了 在cs页取得当前Web页输出的HTML - 我不是冷狐冲,我就是一酒壶 - 博客园 VML学习笔记(本人会不断更新此文章) 长白山游记 贪吃蛇 C# C/S下DataGrid根据数据库里的值(int型)显示ImageList里的图片
MVC框架下的图表使用(一)
我不是冷狐冲,我就是一酒壶 · 2010-08-14 · via 博客园 - 我不是冷狐冲,我就是一酒壶

  因为最近的项目用到了MicrosoftMVC框架,有一些心得记录下来,先说一说图表的使用,决定用MSChart来试试,MSChartMicrosoft推出的free的控件,已经集成在VS2010

下面先列出MSChart相关的链接

下载地址:http://www.microsoft.com/downloads/details.aspx?FamilyID=130f7986-bf49-4fe5-9ca8-910ae6ea442c&DisplayLang=en

For VS 2008工具箱支持

http://www.microsoft.com/downloads/en/confirmation.aspx?familyId=1d69ce13-e1e5-4315-825c-f14d33a303e9&displayLang=en

开发实例

http://code.msdn.microsoft.com/mschart/Release/ProjectReleases.aspx?ReleaseId=1591

文档

http://www.microsoft.com/downloads/details.aspx?FamilyId=EE8F6F35-B087-4324-9DBA-6DD5E844FD9F&displaylang=en

下载完之后,先安装MSChart,之后再安装MSChart_VisualStudioAddOn,这时我们就可以在VS2008的工具箱里看到这个MSChart了(开发实例实际就是一个图文并茂的文档,非常好,里边有大量的代码可用)

在使用MSChart之前,先说明几个概念:

1、 Coordinate System坐标系统

ChartControl的坐标系统是一个相对的坐标系统,使用相对坐标系统可以在调整图表控件的大小时,始终有参照物,坐标系统的起点在左上角(如果是3D的图形,则Z轴是向外扩展的)

2、 图表图片

坐标值可用图片的宽和高来度量

  下边来说说怎么在MVC下使用MSChart控件,因为MVC框架上是不提倡使用服务器控件的,所以我们就不以code behind的方式来使用MSChart控件了,这时我们将代码写到ASPX页面下,分别以Pie图及Area图为例,以下为Pie图在ASPX页面下的代码,Area图大同小异了

代码

System.Web.UI.DataVisualization.Charting.Chart Chart1 = new System.Web.UI.DataVisualization.Charting.Chart();
                        Chart1.Width 
= 412;
                        Chart1.Height 
= 296;
                        Chart1.RenderType 
= RenderType.ImageTag;// Populate series data
                        double[] yValues = { 60756035100 };
                        
string[] xValues = { "武侠类""技术类""体育类""英文类""科教类" };

                        Series defaultSeries 

= new Series();

                        defaultSeries.Name 

= "Default";
        
                        Chart1.Series.Add(defaultSeries);
        
                        Chart1.Series[
"Default"].Points.DataBindXY(xValues, yValues);// Set Doughnut chart type
                        Chart1.Series["Default"].ChartType = SeriesChartType.Pie;// Set labels style
                        
//Chart1.Series["Default"]["PieLabelStyle"] = "Disabled";// Set Doughnut radius percentage
                        Chart1.Series["Default"]["DoughnutRadius"= "30";// Explode data point with label "Italy"
                        
//Chart1.Series["Default"].Points[4]["Exploded"] = "true";// Enable 3D
                        ChartArea charArea = new ChartArea();

                        charArea.Name 

= "ChartArea1";
                        Chart1.ChartAreas.Add(charArea);
                        Chart1.ChartAreas[
"ChartArea1"].Area3DStyle.Enable3D = true;
                        Chart1.ChartAreas[
"ChartArea1"].Area3DStyle.Inclination = 45;

                        Legend legend 

= new Legend();
                        Chart1.Legends.Add(legend);
                                          
                        
// Render chart control
                        Chart1.Page = this.Parent.Page;
                        HtmlTextWriter writer 
= new HtmlTextWriter(this.Parent.Page.Response.Output);
                        Chart1.RenderControl(writer);

  这段代码也可以写到ascx页面,不过有一句代码要修改一下

  Chart1.Page = this.Page; 要改成 Chart1.Page = this.Parent.Page;

  在MVC框架下就用这种方式了,或者有兴趣可以写一个htmlhelper的扩展方法,这就是MSCodeMVC框架下的使用方式,下边重点还是说说这个控件的各个属性

  还是以我最喜欢的书店数据库为例,不过数据是hard coding的,这个图表显示的是几种类型书籍的销售情况:
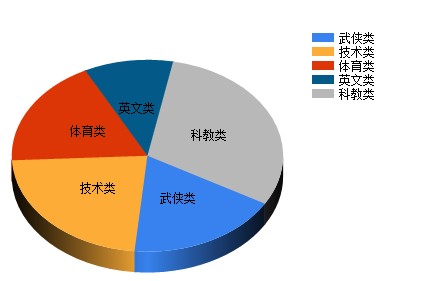
  

  Chart对象的三个属性width,heightrendertype就不说了,大家一看就能知道是做什么的,呵呵

  Series对象是Chart对象的主体,图表的数据及显示的类型就都通过它来设置了

  下边说说它的属性

  Point:主要保存图表的数据

  ChartType:图表样式

  DoughnutRadius:旋转角度

  下面看看相关的效果
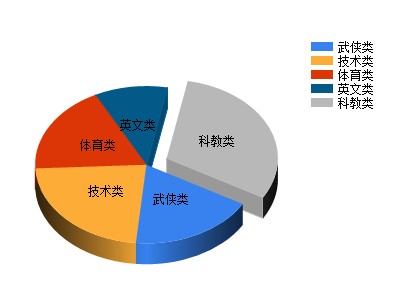
  

  增加如下属性:

  Chart1.Series["Default"].Points[4]["Exploded"] = "true";
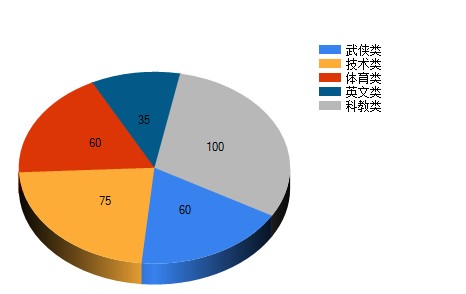
  

  增加如下代码:

代码

for(int i = 0;i < Chart1.Series["Default"].Points.Count;i++)
                        {
                            Chart1.Series[
"Default"].Points[i].Label = yValues[i].ToString();
                            Chart1.Series[
"Default"].Points[i].LegendText = xValues[i];
                        }

  ChartArea对象主要设置Chart显示的相关属性,并可以将Series对象分组

  Legend对象就是右边那一列数据项的名称

  讲了这些,对于我们平时的应用差不多就够了,下回再讲一下Area图的设置